The information contained in this document is provided for general information purposes only, is not provided for decision making nor for use in design, and must not be relied on as specific advice in connection with any decisions the reader may make. Statements contained in this document that state Ascent Engineering Inc.’s expectations or predictions of the future are forward-looking statements intended to be covered by the safe harbor provisions of the Securities Act of 1933 and the Securities Exchange Act of 1934. The words “believe,” “estimate,” “expect,” “forecast,” “could,” “may,” “will,” “targeting,” “illustrative,” or other similar expressions identify forward-looking statements. It is important to note that actual results could differ materially from those projected in such forward-looking statements. No representations or warranties, express or implied, are made by Ascent concerning the applicability, suitability, accuracy, or completeness of the information contained herein and Ascent does not accept any responsibility whatsoever for the use of this information. Ascent is not liable for any action the reader may take as a result of relying on such material or for any loss or damage suffered as a result of taking this action.
Crude oil has been the foundation of modern civilization for over a hundred years, but the world appears to be at the precipice of a shift towards renewable energy, electrification, and CO2 reduction. From transportation fuels to plastics to household cleansers and cosmetics, petroleum products are an essential part of everyday life. In recent years, however, the world has begun moving towards electrification and renewable energy and has seen significant changes in attitudes towards carbon consumption and greenhouse gas (GHG) emissions. Electrification is evidenced by the growth of Tesla into the largest automobile manufacturer with a market capitalization equal to the next nine largest automobile manufacturers combined. Virtually all automobile manufacturers have committed to electrification. Big name companies in the oil industry such as ExxonMobil, Shell, and ConocoPhilips have issued statements regarding sustainability and plans for reduced GHG emissions in the future. Many countries have targeted carbon neutrality by 20501 and have issued government mandates to achieve this. But even if every new car were to be electric by 2030, which is beyond even the most forward plans, there will be over a billion existing internal combustion engine vehicles operating for the foreseeable future. Renewable liquid fuels provide a transition fuel until electrification is completed. This changing energy landscape presents opportunities both for refiners who are already established in the oil and gas industry to produce renewable fuels as well as for entrepreneurs with emerging renewable processes to gain a foothold in the age of renewable energy. Ascent Engineering has a well established history of expertise in successful and innovative refinery retrofits and is also well positioned to help new renewable processes make the transition from the laboratory to commercialization.
It is hard to imagine modern civilization today without the contributions from crude oil. In 2019, crude oil supplied 33% of the world’s energy with the balance from coal (27%), gas (24%), and non fossil fuels (16%) including solar/wind/hydro, biofuels, and nuclear.2 Only about 10% of global energy is renewably sourced. Petroleum based gasoline, diesel, and jet fuel are the primary energy sources for transportation. As the world looks to reduce emissions, renewable fuel options include utilizing sustainable feedstocks to source transportation fuel or making a switch to electric vehicles. While electric vehicles are gaining traction in the United States and the world, the global generation of electricity is still heavily coal based and is not currently a carbon neutral energy source. With over 280 million cars, trucks, busses, and motorcycles on the road in the U.S. alone,3 there is a large installed base of internal combustion engine (ICE) vehicles that can see reduced CO2 emissions in the near term by incorporating renewably sourced liquid transportation fuels, even if electric vehicles are the future. Until the worldwide electrical grid is made to be less carbon intensive, renewable liquid fuels can produce less CO2 than an electric vehicle relying on the existing electrical grid utilizing high carbon sources such as coal. With mandates and government incentives, producing alternative liquid fuels can be a profitable way for existing refiners to effectively revamp their existing assets, and also for new technologies to produce alternative liquid fuels.
Carbon dioxide (CO2) is the primary component in greenhouse gas emissions from transportation fuels, although methane (CH4) is more potent in its ability to trap heat. There are other pollutants in vehicle emissions such as particulate matter, volatile organic compounds (VOCs), nitrogen oxides (NOx), carbon monoxide (CO), and sulfur dioxide (SO2). According to the U.S. Environmental Protection Agency (EPA), the transportation sector is the largest producer of greenhouse gases in the U.S.
The United States has a “Statement of Intent” to be carbon neutral by 2050,1 meaning carbon dioxide output is to have a net neutral impact to the environment. Since all fossil fuels are carbon based, they will always produce CO2 upon combustion and are therefore incompatible with this intent. Carbon capture and sequestration (CCS) can be used to reduce CO2 emissions at the source, and some producers are planting trees to offset some of the carbon emissions. However, to fully meet the intent, the U.S. will need to invest heavily in renewable energy.
Emissions are considered “well-to-wheel”, that is at every step along the way from sourcing the feedstock, processing it into transport fuel, and consumption in the vehicle. Oil and gas companies can become carbon neutral for direct emissions from company operations and indirect emissions from consumed energy.4 Carbon intensity (amount of carbon by weight emitted per unit of energy consumed5) of petroleum-based products can be reduced by mixing biologically made renewable fuels with the petroleum fuels. The feedstocks for renewable fuels include various plants and animal fats. Blue hydrogen (produced from petroleum-based sources, but the carbon is captured and sequestered) or green hydrogen (produced entirely from non-petroleum-based sources) can be used for refinery hydroprocessing.
Renewable fuels facilities can be incorporated into existing refinery facilities. A refiner may consider a retrofit to existing hydroprocessing facilities to process renewable feedstocks into renewable fuels. It is possible and economically advantageous with government credits to process the renewable fuels in a mixture with petroleum-based fuels. Incorporating the use of green sources of energy such as wind or solar or re use of waste gases for the production of the petroleum-based fuel uses renewable energy in the existing transportation fleet.
A knowledgeable engineering firm can work with owners and licensors to deliver process units capable of meeting the renewable fuels requirements. Ascent Engineering is ideally positioned to evaluate existing equipment for retrofit as well as new processes and to strike the balance between the licensor’s requirements and the refiner’s existing assets.
Humans have always aimed to advance the latest technology and automobiles are no exception to the rule. While steam was the earliest automobile fuel of choice, by the mid to late 19th century, steam was all but forgotten and it remained to be seen whether gasoline or electric would rule the industry. Gasoline powered vehicles were noisy, dirty, and difficult to start due to a hand crank. Electric vehicles were silent, clean, and provided an instant start, but there was insufficient infrastructure for charging batteries. The charging problem was solved with widespread availability of electricity at the turn of the century; however, electric cars simply could not compete with the range provided by a gasoline powered car. Additionally, gasoline was cheap and efficient, and suddenly the automotive industry found itself on the path of fossil fuels.6
Now, more than a century later, the world of transportation fuels is seeing the next big transformation. Government mandates to reduce carbon emissions, improved battery technologies allowing further range, and sustainable feedstocks for use in the existing fleet are changing the future fleet’s fuel mix. Technology is being developed to process a widening assortment of sustainable feedstocks and to discover different pathways to create the renewable energy sources. The large base of existing ICE vehicles on the road represent a huge consumer pool for renewably sourced fuels as a way to reduce emissions for the duration of these vehicles’ serviceable lives.
The energy rich liquid which is commonly known as gasoline has evolved over the last century and a half. The light liquid, historically produced by distilling crude oil, was initially disposed of as a waste product. It was a necessary waste to retrieve the precious kerosene. The heavy liquid which was left after recovering kerosene was also disposed of as waste. Technological advances have led to major improvements in the quality and quantity of gasoline. With the focus on renewable feedstocks for liquid fuel production, it is key for the technology to maintain modern standards for gasoline performance and fuel efficiency. Ascent can help guide a refiner to optimize their plant configuration to achieve this.
The invention of the automobile in 1892 along with gasoline’s high efficiency as a fuel source led to gasoline becoming a valuable fuel. Increasing automobile numbers increased the demand for gasoline supply. Concurrently, electrification of lighting reduced the demand for kerosene. The problem of gasoline undersupply and kerosene oversupply was solved with the development of thermal cracking. The heavier portion of crude was cracked into gasoline range material. The cracked gasoline was blended with the straight run gasoline. Light and heavy liquids were blended to achieve the desired density of gasoline.
Gasolines from different crudes along with blending of cracked gasolines led to wide variations in the performance of automobile and aviation engines. Since crude compositions vary widely, the quality of the straight run gasolines also varied widely. Early gasoline was rated based on Baume scale and volatility.
Abnormal combustion is a phenomenon where the gasoline vapor burns by heat and compression prior to the spark from the spark plug. This pre-ignition can lead to hot running engines with reduced power and potential damage due to “knock”. Different gasolines have different resistance to abnormal combustion. Aromatic and naphthenic gasolines, with their higher octanes, have higher resistance to knock than paraffinic gasolines.
Until 1929, there was no consistent standard for gasoline quality. In 1929, the octane rating scale was adopted. Octane is a measure of how much compression gasoline can withstand before igniting. A higher octane number can handle higher compression and is less likely to suffer pre-ignition. Octane of gasoline is measured against a mixture of iso octane (2,2,4-trimethylpentane) and n heptane. Iso octane is assigned an octane number of 100 while n heptane is assigned an octane number of 0. The octane of gasoline is measured by running it in a test engine with variable compression ratio. The test results are compared to mixtures of iso octane and n heptane. RON is the Research Octane Number and is determined by running the fuel in a test engine at idle conditions. MON is the Motor Octane Number and is determined by running the fuel in a test engine at higher speeds and temperatures. The octane number reported at the gas pump is the average of the two, or (R+M)/2.
Air quality became a concern as industrialization released pollutants into the atmosphere. Ambient air quality in the United States was regulated by congress and the U.S. Environmental Protection Agency (EPA) was formed in 1970 to provide consistent national guidelines for protecting the environment, as well as to monitor and enforce the subsequent regulations. In the same year that the EPA was founded, the Clean Air Act was passed which, among other responsibilities, allowed the EPA to regulate emissions from light duty vehicles. Later, amendments were passed to the Clean Air Act to introduce stricter emissions regulations. For gasoline-powered automobiles, the biggest U.S. national impact came in the form of Reformulated Gasoline (RFG) program (passed in 1990, phased in 1995-1999), Tier 2 (passed in 1999, phased in 2004 2009), and particularly the current Tier 3 regulations for emissions from light duty vehicles passed in 2014 and phased in 2017-2025.7 The RFG program was aimed at overall smog reduction (VOCs, NOx, and toxic pollutants) by mandating oxygenate blending through two phases of emission restrictions. The Tier 2 Gasoline Sulfur program imposed a restriction on sulfur levels to 30 ppmw by 2006 (though some small refiners had some leniency to an 80 ppmw cap). The Tier 3 Gasoline Sulfur program imposed a tighter restriction on sulfur levels to 10 ppmw. Ascent has successfully worked with various clients to achieve Tier 3 compliance.
As gasoline technology has progressed and as regulations have changed, various additives have been included in gasoline blendstocks to increase performance and reduce emissions. Many of these are oxygenates, or oxygen bearing compounds which promote combustion. The addition of oxygenates reduces carbon monoxide in the exhaust. Use of such oxygenate blends came to prominence in the 1970s partly as a result of the oil embargo driving up oil prices; domestically sourced additives helped to reduce U.S. need for foreign oil and was more environmentally friendly as well.
TEL:
Tetraethyllead (TEL) was used for many years to increase the octane of gasoline. The increased octane using TEL allowed the development of more efficient engines with higher compression ratios. Unfortunately, TEL is toxic and the effects of lead poisoning in children and emissions to the environment were the primary reasons for the phase out. Worldwide, TEL phase out from road gasoline began in the 1970s. Japan was an early adopter of unleaded gasoline and stopped using leaded gasoline by 1980. Many other countries such as Canada and much of Europe had completed TEL phase out by the mid-1990s including the United States by 1996.8
MTBE:
MTBE (Methyl tertiary-butyl ether) was introduced as an oxygenate to improve combustion and reduce tail pipe emissions. The miscibility of MTBE with ground water has caused its use to be discontinued in the U.S. MTBE can be tasted in water at very low concentrations. Health risks associated with MTBE have not been quantified, but it is believed to be a human carcinogen.
Ethanol:
Ethanol has been around for well over a hundred years as a fuel source and its use as a gasoline additive has waxed and waned over the years as driven by wartime needs and taxes.9 Ethanol is a high octane oxygenate as well as a renewable energy source. The production and consumption of ethanol is part of the renewable energy requirement in today’s regulatory environment and it is by far the largest volume of renewable fuel stock in the United States.
Automobile fuel economy requirements are driving improvements in engine efficiency. The current U.S. federal Corporate Average Fuel Economy (CAFE) requirement is that the industry fleet wide average mileage for cars and light duty trucks be 40.4 mpg by 2026.10 On the manufacturing side, the industry is trending towards smaller engines. The smaller displacement (as well as reduced weight) help improve fuel economy, while modern technology can exact as much or more power from the smaller displacement engines. On the fuel side, automobile manufacturers such as General Motors are asking for improvements in fuel performance in order to help maximize engine efficiency. This would include higher octane fuel with higher RON and higher sensitivity (RON-MON). In lay terms, higher sensitivity means more stability at low temperatures and faster reactions at high temperatures to allow for high compression engines.11
Ethanol:
As mentioned above, ethanol is commonly blended into gasoline as an oxygenate to reduce emissions. It can be produced from any number of renewable feedstock sources. In the U.S., ethanol is commonly produced from corn. Because ethanol counts as renewable fuel and is already so readily available, there is incentive to use more of it in gasoline blends. The most common ethanol blend contains up to 10% ethanol (E10), although in 2011 the EPA allowed use of up to 15% ethanol (E15) in automobile models from 2001. Gasoline with 85% ethanol (E85) is also available for automobiles which are specifically designed for it (flex fuel). Because ethanol is such a good solvent, specially designed fuel injection systems are required to prevent corrosion. Additionally, because ethanol has an oxygen atom, therefore it is a partially oxidized hydrocarbon, it contains less energy upon combustion than a non-oxygenated hydrocarbon. E10 gasoline typically has a 3 to 4% lower fuel mileage than 100% gasoline. E15 gasoline mileage is typically 4 to 5% lower than 100% gasoline. E85 gasoline can have 51 to 83% ethanol and 15 to 27% lower mileage.12
Diesel is a crude oil fraction named after the inventor of the diesel engine, Rudolf Diesel. Rudolf Diesel sought to develop an engine with 100% efficiency. In his attempts to achieve this, he increased the compression ratio. Unlike spark ignited engines, diesel engines rely on the high temperature of the compressed air to ignite the fuel once it is injected into the cylinder under pressure. Since the fuel is not compressed as a mixture with air, it does not have the problem of preignition that gasoline engines have. The compressed air in a diesel engine reaches temperatures above the autoignition temperature of the fuel. When the fuel is injected into the hot compressed air cylinder, it ignites, causing the power stroke of the cylinder. By having very high compression ratios relative to gasoline engines, much higher fuel efficiency can be achieved. Diesel also produces more power per gallon because of its higher density than gasoline. During his lifetime, Diesel achieved engine efficiencies over twice that of gasoline engines.
Diesel engine efficiency has historically made diesel engines the engine of choice for industry and in Europe. Diesel has higher energy content per unit volume than gasoline. This is principally due to the density difference. Gasoline density varies from 45 to 49 lb/ft3 (721 to 785 kg/m3) while diesel density varies from 51 to 60 lb/ft3 (817 to 961 kg/m3). Since the heating value of all hydrocarbons is roughly 20,000 BTU/lb (46,500 kJ/kg), the higher diesel density translates to higher energy content. Diesel has roughly 10 to 15% more energy than gasoline on a per volume basis.13
The higher diesel energy content and engine efficiency compared to gasoline engines yields higher fuel mileage. Because diesel engines do not use a spark ignition to combust the compressed air and fuel mixture, they do not suffer from pre-ignition. This allows diesel engines to be designed for much higher compression ratios (14 to 22) than gasoline engines (8-11). Modern truck diesel engines can achieve 40 to 47% efficiency versus spark-ignition engine efficiency at 30-36%.14
In the United States, the allowable sulfur content in diesel fuel was reduced to 500 ppm in 1993. Prior to that, diesel sulfur content could be as high as 5,000 ppm. This low sulfur diesel was introduced to reduce sulfate particulate emissions. Hydrotreating is the primary means of reducing sulfur in diesel.
Ultra low sulfur diesel (ULSD – 15 ppm) was phased in beginning in 2006. After 2010, the EPA required that all diesel supplied to the U.S. market be ULSD and that all diesel vehicles use ULSD.15 The lower sulfur content requires more severe hydrotreating.
Like octane for gasoline, cetane number is a measure of diesel fuel performance. Cetane number is an indicator of a fuel’s ignition characteristics, specifically a measure of ignition delay after injection into the cylinder. A higher cetane number is indicative of less ignition delay, which translates to better engine performance. Cetane number is determined by a test performed on a standard single cylinder, variable compression ratio, diesel engine and comparing the fuel against a mixture of cetane (cetane number = 100) and heptamethylnonane (cetane number = 15). In order to avoid testing every fuel, cetane index was developed as a calculated approximation of a fuel’s cetane number. The cetane number measured by cetane index is calculated by a formula using a fuel’s density and distillation range according to American Society for Testing and Materials (ASTM) D-86 T10, T50, and T90.16 The calculated cetane index is +/-2 numbers from the cetane number.
Conventional Diesel, Biodiesel, Renewable Diesel, and the Future
While electrification has begun replacing gasoline, electrification has made lesser inroads to date in the higher energy demand industrial diesel market. Newly emerging electric semi trucks struggle with range per charge and long charging times as well as large battery size, which result in longer travel times and smaller loads (if competing for space with the large battery). Large scale use of heavy duty electric vehicles is still a number of years away. Renewable diesel produces less CO2 than conventional diesel while providing the same high energy density required for heavy duty transport until electric technology catches up. Renewable diesel is cleaner burning than its conventional or biodiesel counterparts in addition to having a better cetane number for higher performance.
It is important to note that there are a number of terms surrounding diesel fuel that oftentimes get confused. Conventional diesel is traditional, petroleum-based diesel that is made from crude oil in an oil refinery. Biodiesel is not sourced from fossil fuels; rather it comes from renewable sources such as vegetable oils or animal fats. It is produced by a process called transesterification, or reaction of a glyceride and an alcohol (usually methanol) to make biodiesel (fatty esters) and glycerol. Biodiesel properties differ from conventional diesel in that biodiesel solidifies at cold temperatures, may separate during storage, and most importantly, the chemical structure differs enough that biodiesel cannot be used as a stand-alone substitute for conventional diesel fuel – it must be blended prior to use in traditional diesel engines. Finally, while renewable diesel is sourced from the same feedstocks as biodiesel, the process to produce it is more like that of conventional diesel. Because renewable diesel sees the same hydrotreating processes as conventional diesel, it has the same chemical structure as conventional diesel and can be used without blending. Renewable diesel does not contain oxygen and thus does not have the same cold and storage issues as biodiesel.
There are two main government renewable fuel incentive programs that are currently differentiated on a national and state level in the United States.
The Renewable Fuel Standard (RFS) is set by the Environmental Protection Agency (EPA) on the national level.
Any of a number of carbon fuels programs adopted on the state government level. Current programs in effect and other state progress as of Q2 2021 include the following:
California – Low Carbon Fuels Standard (LCFS) – currently in effect
Oregon – Clean Fuels Program (CFP) – currently in effect
Colorado – GHG Reduction Roadmap has been established, but its feasibility study on carbon fuels program concluded not to adopt. Instead, a zero emission vehicle mandate is part of the roadmap.
Utah – Air Quality Roadmap has been established, but acts as a loose guideline with no call out of a carbon fuels program. Zero emission vehicle focus is called out in the roadmap.
New York – State Senate Bill S2962A establishes the Clean Fuel Standard and is in committee.
Washington – State House Bill 1091 establishes the Clean Fuel Standard and State Senate Bill 5126 establishes a carbon cap-and-trade program and both have passed through voting committee. The programs will be in effect January 2023 once signed by the governor.
Minnesota – State House Bill HF 2083 dubbed the “Future Fuels Act” was introduced in the Minnesota House of Representatives and referred to the House Committee on Commerce, Finance and Policy.
In addition, Canada has recently published proposed regulations for its Clean Fuel Standard, to be implemented nationwide, with final regulations to be published in 2021. The expected enforcement of the Clean Fuel Standard is at the end of 2022. As of 2021, British Columbia is the only province of Canada that has a carbon program in effect, known as the British Columbia’s Low Carbon Fuel Standard (BC-LCFS).
Unless otherwise noted, any reference to a low carbon fuels program in this text refers to the California LCFS program as they are the largest market for carbon credits.
The subtle difference between the federal RFS program and the California LCFS program is that the RFS program is aimed at directly setting renewable fuel volumes, driving the demand for the national bulk production and use of renewable fuels, with concomitant reduction in greenhouse gas (GHG) emissions. The LCFS program is aimed at directly setting carbon volumes, as opposed to renewable fuel volumes, and requires a more stringent carbon accounting in the life cycle of the final fuel product.
The RFS and LCFS programs financially impact refiners and importers of gasoline and/or diesel sourced from petroleum. Both of these programs are designed to incentivize renewable fuel production and carbon emission reduction. Both programs introduce a supply-and-demand market of credits. Both programs put petroleum-based refiners and importers into a deficit position, creating the “demand” of renewable fuel and carbon credits. The “supply” of the credits comes from entities that generate a renewable fuel with a proven pathway of reduced GHG emissions compared to petroleum-based fuels.
In the RFS program, refiners must either purchase credits (referred to as Renewable Identification Numbers, or RINs) or physically blend renewable fuels into their gasoline and diesel fuel pool to meet compliance. Furthermore, the RFS program requires four different categories of renewable fuels to blend as part of meeting compliance. These four categories include fuels derived from cellulosic, biomass, advanced, and renewable feedstocks.
In the LCFS program, the main focus is carbon emissions attributed to the life cycle pathway to generate gasoline and diesel. Every year, the California Air Resources Board (CARB) updates the CI (carbon intensity) scores of California fuels (CARBOB, or California Reformulated Gasoline Blendstock for Oxygenate Blending, and ULSD) and this sets the emissions life cycle of gasoline and diesel fuel sold in California, and for all obligated parties to which it is subject. The CI scores of these fuels are relatively high due to being sourced from carbon emitting intensive processes. The LCFS program sets a CI benchmark reduction target for these fuels, for which a delta in CI score between the higher CI fuel and lower CI benchmark exists, creating the deficit position and “demand” for credits. Entities that provide alternative fuels with a proven life cycle pathway CI score lower than the benchmark is the “supply” of credits to which obligated parties in a deficit position can purchase. CARB offers programs for obligated parties to consider in order to offset their deficit position.
The United States EPA has implemented a national RFS program which is the foundation of America’s renewable energy policy. This national policy is aimed at reducing oil imports and protecting the environment by reducing air pollution and greenhouse gas emissions. The RFS program has gone through a history of amendments and expansions dating back to its initial creation under the Energy Policy Act of 2005.17
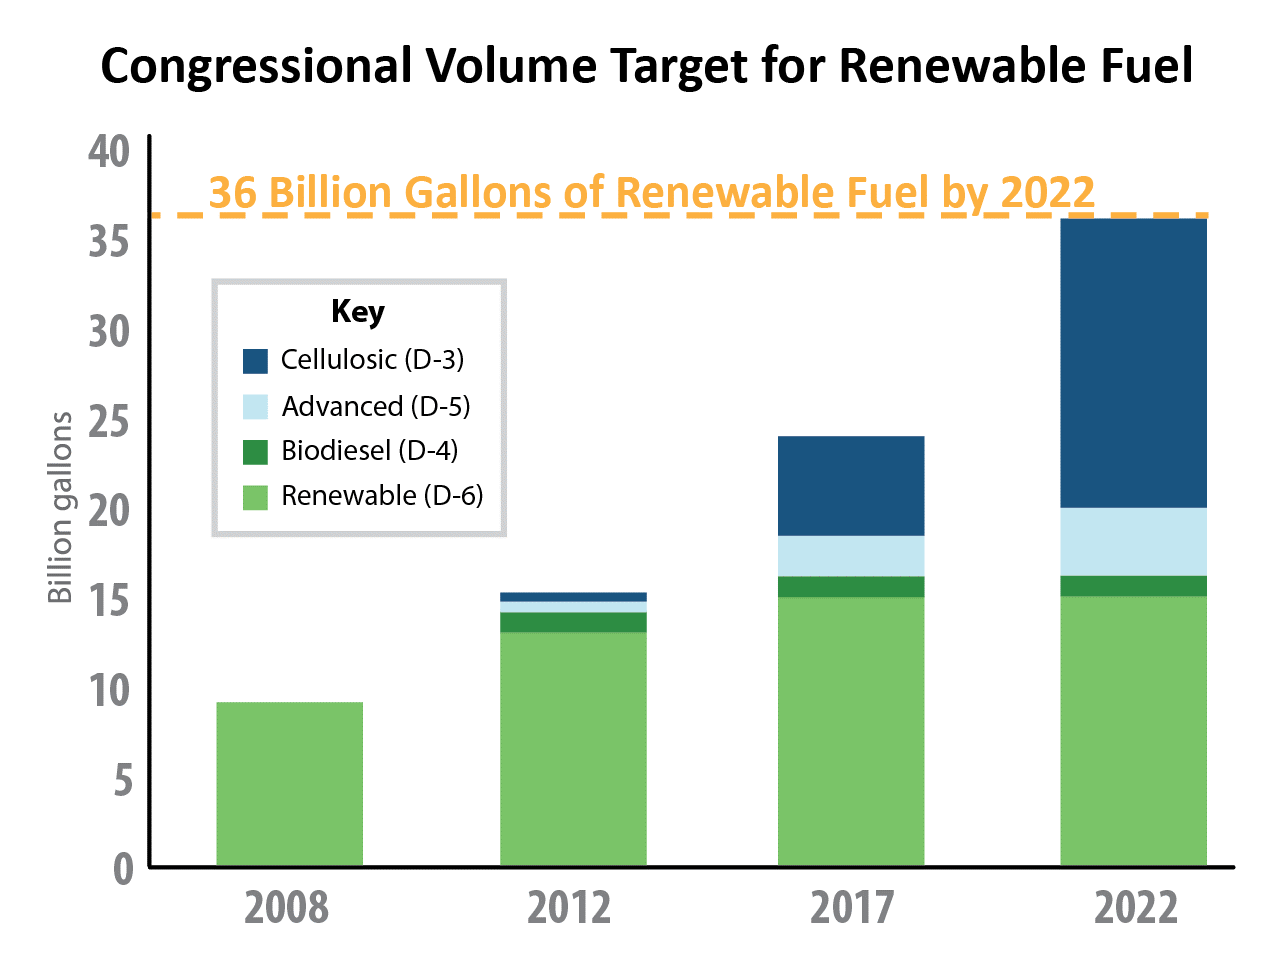
The RFS program is a national policy that requires a certain volume of renewable fuel to replace or reduce the quantity of petroleum-based transportation fuel. The Energy Independence and Security Act of 2007 (EISA) specifies the total RFS volume requirements through the year 2022. The long-term goal is 36 billion gallons annually (2.35 million BPCD or 11.2 million m3/m) of total renewable fuel by 2022. The law requires EPA to set RFS volumes for 2023 and beyond, according to certain criteria defined in the statute. Figure 1 below shows the RFS EPA congressional volume targets.18 The detailed tabulated values can be found on the EPA website.
Figure 1: RFS EPA Renewable Fuels Volume Targets
Obligated parties under the RFS program are refiners or importers of gasoline and/or diesel fuel. Based on the renewable fuels volume targets in the graph above, this sets a regulated party’s Renewable Volume Obligation (RVO), the deficit position. Compliance is achieved by blending renewable fuels into transportation fuel or by obtaining credits called Renewable Identification Numbers (RINs) to meet the EPA-specified RVO. To be explicit, the regulated party is obligated to blend and meet each of the four different types of renewable fuel targets into their fuel pool. The EPA sets the RVO requirement and refiners or importers must demonstrate compliance annually. For example, a transportation fuel sourced from 100% fossil fuel will not meet compliance. The refiner or importer must purchase a renewable fuel source under the RFS program with RINs attached and blend it into the transportation fuel to meet the annual RVO. It is also possible to purchase RINs as credits to meet compliance.
There are four different categories of renewable fuels that the RFS program mandates for obligated parties to blend into their fuel pool. The RVO for each of these four categories must be met for each compliance year. The four categories are essentially categorized by a combination of the feedstock and minimum GHG emission reduction requirement. The four categories and their accompanying RIN codes are as follows, arranged from more advanced RINs to less advanced RINs:
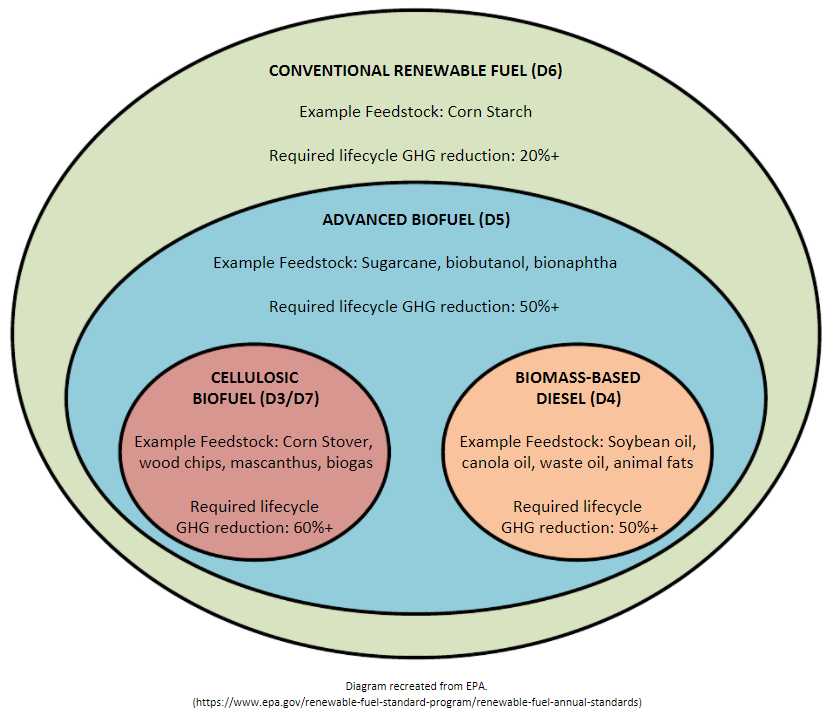
The four categories fit into a “nesting” structure, meaning more advanced RINs can be used for compliance of less advanced fuel categories. Figure 218 and Table 118 convey the same message of how each RIN code can be used for each fuel category, and also described below:
RIN codes D3 Cellulosic Biofuel and D7 Cellulosic Diesel can count for Advanced Biofuel and Renewable Fuel
RIN code D4 Biomass-based Diesel can count for Advanced Biofuel and Renewable Fuel
RIN code D5 Advanced Biofuel can count for Renewable Fuel
Unfortunately, cellulosic production of renewable fuels has not reached commercialization due in part to poor economics. Lack of cellulosic renewable fuels production has led the EPA to sell credits to the industry to satisfy this RIN obligation.
More RINs can be generated from higher energy content fuel compared to ethanol as the base fuel. A single RIN has the energy equivalency as 1 gallon of ethanol, hence renewable fuels with higher energy content than ethanol can generate more than 1 RIN per gallon. For example, biodiesel can generate 1.5 RIN, renewable diesel can generate 1.7 RIN, and butanol can generate 1.3 RIN.
Figure 2: Fuel Nesting Scheme for RFS Program
Table 1: D-Code Compliance to the Four Fuel Categories
D-Code
Cellulosic Biofuel
Biomass-Based Diesel
Advanced Biofuel
Total Renewable Fuel
3
X
X
X
4
X
X
X
5
X
X
6
X
7
X
X
X
For a renewable fuel to qualify under the RFS program and generate RINs, a petition must be submitted to EPA for review and approval. The critical assessment of the renewable fuel is the lifecycle greenhouse gas emissions analysis, and it must demonstrate a reduction in GHG emissions compared to a 2005 petroleum baseline. EPA's lifecycle analysis for the RFS includes emissions related to:
All sources of carbon emissions are considered as part of a GHG life cycle pathway for any transportation fuel, which also includes grid electricity. The majority of the U.S. produces grid electricity by carbon emitting processes. A renewable fuels facility that powers process equipment from carbon-sourced grid electricity will still have a GHG emission footprint. A renewable fuels facility has lower life cycle GHG emissions than a petroleum based facility, but can still be better improved by sourcing electricity from zero emission sources. Consuming renewable fuels is a first overall step in reducing GHG emissions in the transportation sector for existing internal combustion engines. Utilizing renewable electricity minimizes the GHG footprint of renewable fuels and is a step towards electrifying the existing ICE fleet without total fleet replacement. Transitioning the grid electricity to zero emission sourced, combined with adoption of electric vehicles, would be the second step to achieve near zero carbon emission in the transportation sector.
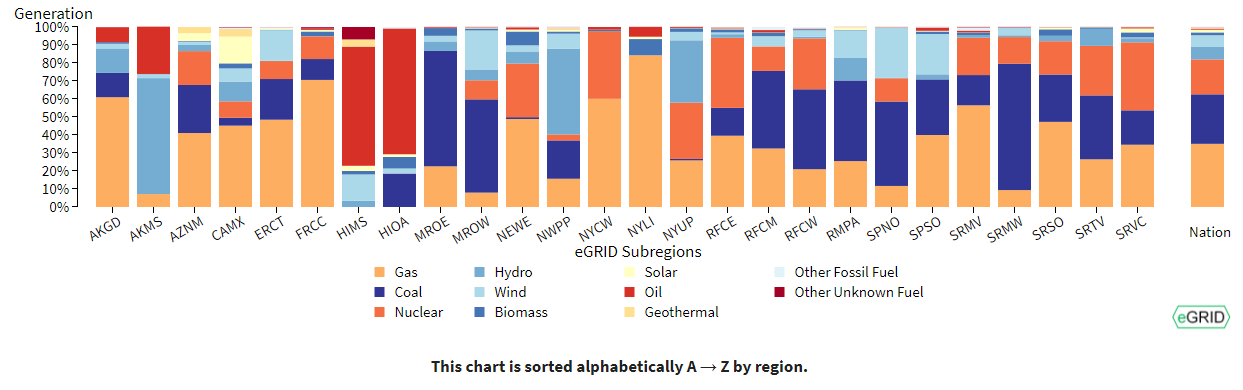
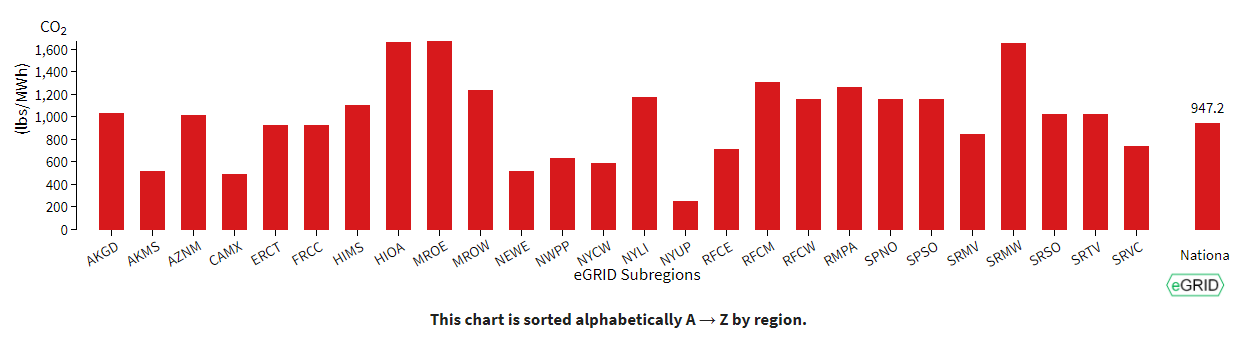
Specific only to the RFS program, the lifecycle GHG analysis uses the EPA Emissions & Generation Resource Integrated Database (eGRID), where the U.S. is divided into electrical grid regions. Electricity emission factors are an average grid basis that includes the mix of various electricity generation sources. The eGRID is a comprehensive source of data on the environmental characteristics of almost all electric power generated in the United States and is updated periodically. Figure 3 below depicts the eGRID subregions of the U.S. and provides the corresponding CO2 emitted based on the source profile mix. The following Figure 4 and Figure 5 depict a breakdown of the electricity source profile of each region and the corresponding average CO2 emissions.
The eGRID data presented here highlight the fact that the majority of the U.S. electrical grids are currently powered by carbon based sources. California is typically touted to be the green initiative state, and with nearly 50% of the electricity generation powered by natural gas, it has one of the lowest carbon emission rates in the nation. A majority of other U.S. regions have electricity generation portfolios with higher exposure to fossil fuels. From the standpoint of achieving nationwide net zero carbon emissions, a significant overhaul in the U.S. electrical infrastructure is required to support lower CO2 emissions for general electrical use and for transportation use in electric vehicles. Renewable fuels are an interim pathway to achieve lower CO2 emissions for the existing internal combustion engine fleet.
Figure 3: eGRID Subregion Map and Average CO2 Emission RatesFigure 4: Fuel Mix or Sources Used in Electricity Generation
Fuel Mix: This chart compares fuel mix (%) of sources used to generate electricity in all eGRID subregions.Figure 5: CO2 Average Emission Rates
Emission Rates: This chart compares the average emission rates in pounds per MWh in all eGRID subregions to the national average emission rates for CO2.
The LCFS program is designed to decrease the carbon intensity (CI) of transportation fuels pool by providing a mechanism to introduce a range of low carbon and renewable fuel alternatives. The result is a lower carbon footprint for the fuel being consumed. The importance to renewable fuel is the production tax incentives. These will be discussed later but the economics of renewable fuels are LCFS driven.
The carbon intensity is a metric used to measure the carbon emitted per unit of energy consumed throughout the life cycle pathway of a fuel source. Note that the CI score referenced under LCFS program (typically in units of gCO2e/MJ) can be loosely compared to the RFS lifecycle GHG analysis results (typically in units of kgCO2e/MMBtu), but both are calculated by different methodologies.
Carbon intensity is important to regulated parties because CARB establishes annual CI benchmarks for the transportation fuel pool, specifically gasoline and diesel. There is a planned schedule of CI reduction of California’s transportation fuel pool to 2030 and beyond. Regulated parties include fuel importers, refiners, and wholesalers who are required to reduce CI score across their transportation fuel product line. To ensure that the overall California transportation fuel pool meets the annual LCFS CI benchmark target, a regulated entity must lower the CI of its fuel pool (by substituting cleaner fuels) and/or purchase LCFS credits from other regulated entities. LCFS credits do not expire and any surplus of LCFS credits can be banked for future compliance.5
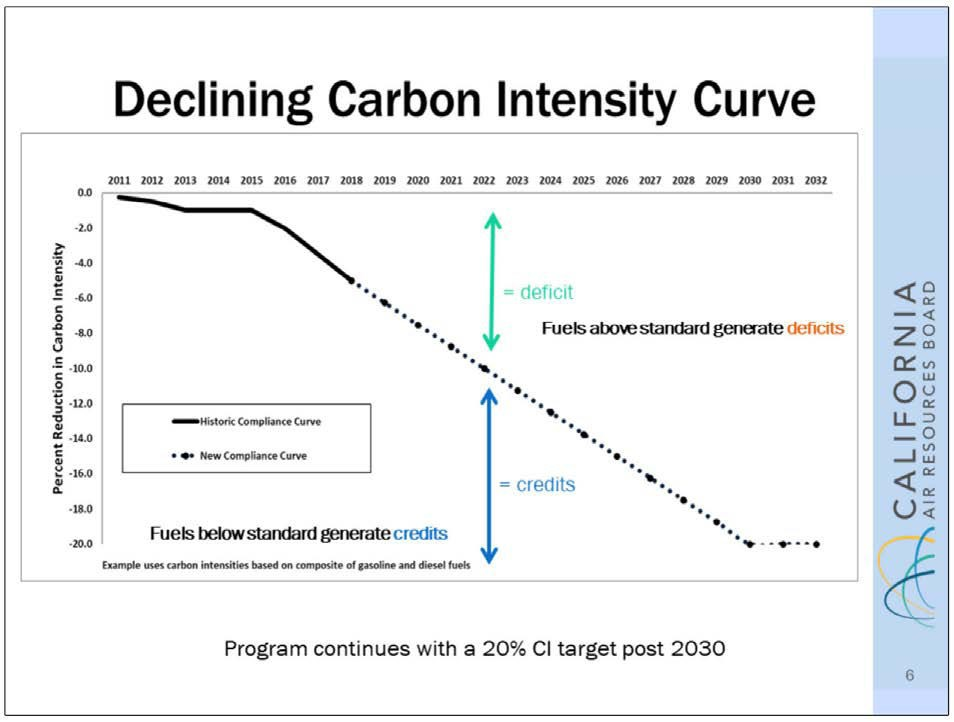
Figure 6 below depicts the overall reduction of the CI benchmark through 2030 and beyond and simplifies the supply/demand interaction of LCFS credits. A regulated party of transportation fuels with deficits must generate or acquire enough credits to be in annual compliance with the standard. Other entities, such as biofuel refiners, electricity, and natural gas suppliers can opt into the program to generate valuable credits so long as the CI pathway for those fuels are lower than the standard.
Figure 6: California LCFS CI Benchmark and Deficit/Credit
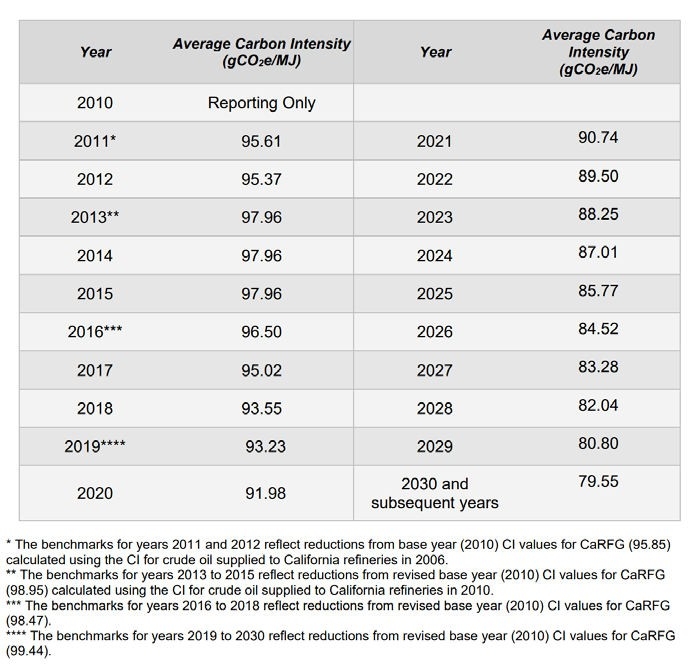
The annual California CI benchmarks through 2030 and beyond can be found in Table 2 and Table 3 below, copied from the CARB website effective July 2020.
Table 2: California LCFS CI Benchmarks for Gasoline
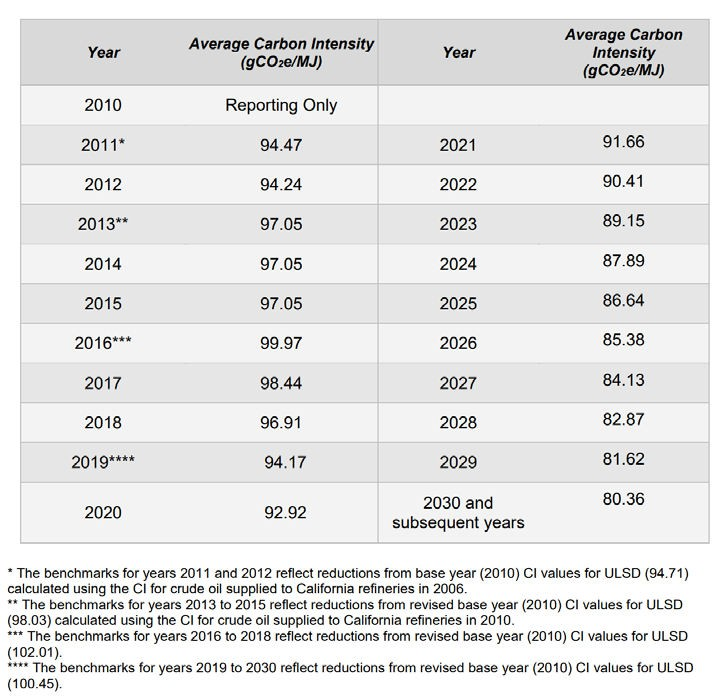
LCFS Carbon Intensity Benchmarks for 2011 to 2030 for Gasoline and Fuels Used as a Substitute for GasolineTable 3: California LCFS CI Benchmarks for Diesel
LCFS Carbon Intensity Benchmarks for 2011 to 2030 for Diesel Fuel and Fuels Used as a Substitute for Diesel Fuel
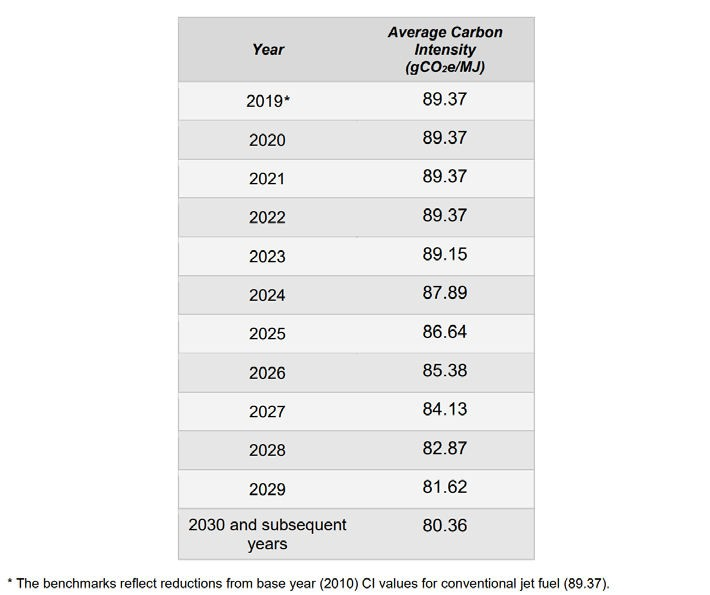
Conventional Jet fuel is currently an exemption to the LCFS program and does not generate deficit to the transportation fuel pool. However, CI benchmarks are established by CARB to determine the credits that can be generated for alternative jet fuel producers.
Table 4: California LCFS CI Benchmarks for Jet Fuel
LCFS Carbon Intensity Benchmarks for 2019 to 2030 for Fuels Used as a Substitute for Conventional Jet Fuel
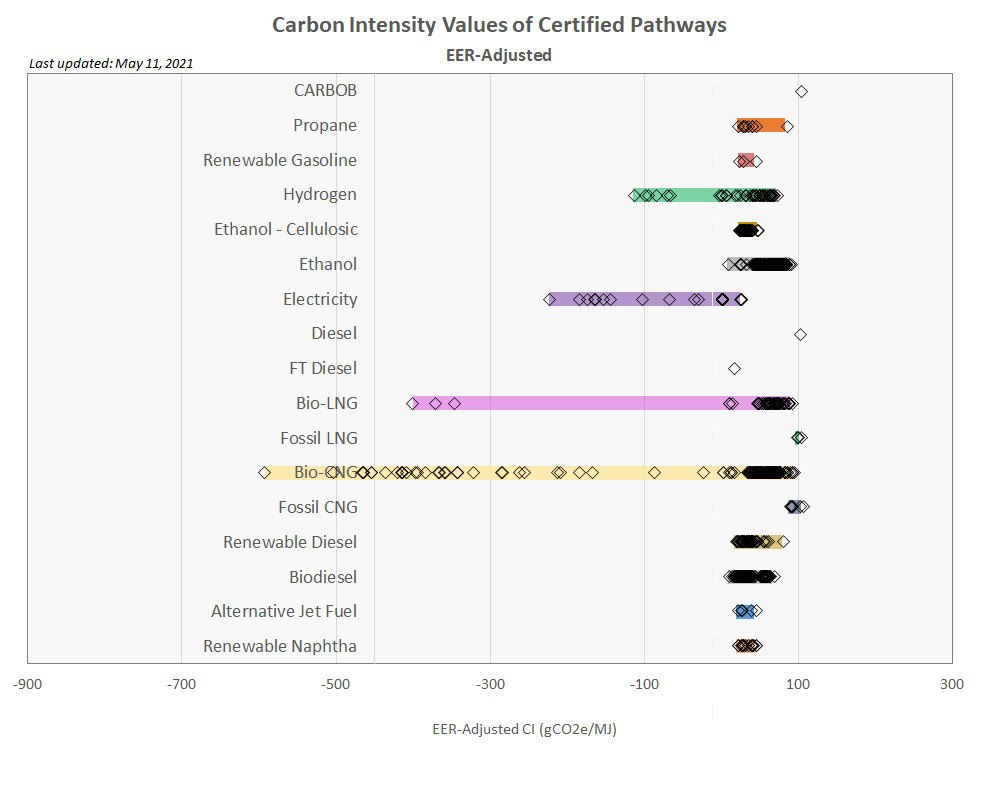
CARB may update the CI score of California fuels periodically based on energy and emission updates along the life cycle pathway. California gasoline and diesel produced from the average efficiencies of California refineries are 100.82 and 100.45 gCO2e/MJ respectively as of 2020. CARB also assigns each alternative fuel an Energy Economy Ratio (EER). An alternative fuel’s CI score divided by its EER results in the EER adjusted CI score, which represents emissions produced from the alternative fuel per MJ of conventional fuel displaced. Refer to Table 5 below for established lookup table by CARB19 and Figure 7 for various EER-adjusted CI scores of common alternative fuels.
Table 5: Lookup Table for Gasoline and Diesel and Fuels that Substitute for Gasoline and Diesel
CARBOB - based on the average crude oil supplied to California refineries and average California refinery efficiencies
100.82
Diesel
ULSD
ULSD - based on the average crude oil supplied to California refineries and average California refinery efficiencies
100.45
Compressed Natural Gas
CNGF
Compressed Natural Gas from Pipeline Average North American Fossil Natural Gas
79.21
Propane
PRPF
Fossil LPG from crude oil refining and natural gas processing used as a transport fuel
83.19
Electricity
ELCG
California average grid electricity used as a transportation fuel in California
93.75 (and subject to annual updates)
ELCR
Electricity that is generated from 100 percent zero-CI sources used as a transportation fuel in California
0.00
ELCT
Electricity supplied under the smart charging or smart electrolysis provision
Refer to CARB Current Regulation
Hydrogen
HYF
Compressed H2 produced in California from central SMR of North American fossil-based NG
117.67
HYFL
Liquefied H2 produced in California from central SMR of North American fossil-based NG
150.94
HYB
Compressed H2 produced in California from central SMR of biomethane (renewable feedstock) from North American landfills
99.48
HYBL
Liquefied H2 produced in California from central SMR of biomethane (renewable feedstock) from North American landfills
129.09
HYEG
Compressed H2 produced in California from electrolysis using California average grid electricity
164.46
HYER
Compressed H2 produced in California from electrolysis using zero-CI electricity
10.51
Figure 7: EER-adjusted CI Values of Certified Pathways
(See LCFS Pathway Certified Carbon Intensities website for up-to-date information)
Note that gasoline (CARBOB) and diesel benchmarks are included for reference alongside the EER-Adjusted CI values shown in Figure 7. Additionally, the length of each bar represents the possible range of CI value for the particular pathway, depending on the full emissions lifecycle of the fuel.
An example deficit calculation for 2020: a California refiner is subject to gasoline and diesel deficits on the order of 100.82 – 91.98 = 8.84 gCO2e/MJ for CARBOB gasoline and 100.45 – 92.92 = 7.53 gCO2e/MJ for ULSD. The impact to refiners in this deficit position is economics. The larger the spread of the CI fuel produced and the benchmark, the larger the credit deficit position.
The price of an LCFS credit hovered just below $200/MT (metric ton) at the end of Q1 2021. Current prices of an LCFS credit can be found on the CARB website, and a weekly snapshot as of end of April 2021 is shown in Table 6 below.
Table 6: LCFS Credit $/MT of CO2
LCFS Weekly Snapshot
Fuel Pathway Code
Transfer Type
All Non Zero
Type 1
Average Price (1) ($/MT)
$190
$175
Price Range ($/MT)
$168 - $213
$168 - $193
Total Volume (MT)
470,789
214,909
Total Value ($)
$89,353,572
$37,506,772
Notes:
Volume weighted average
There are three ways to generate credits in the LCFS program. To be clear, these options are for generating credits and doesn’t lower the deficit position implied annually. The capital costs involved to create these credit generating assets can be considered by refiners in deficit positions to reduce the amount of credit purchasing.
Fuel Pathway-based Crediting – All transportation fuels need a carbon intensity score to participate in the LCFS to generate credits, and the fuel type dictates which process is used to determine that CI. This option will be the most capital-intensive for a petroleum refiner. This is essentially only an option when considering a new renewable feedstock to either replace the petroleum feed or co-process, as this constitutes a new fuel pathway with a lower CI score. Being a petroleum refiner will still be in a deficit position, but a co generation of renewable fuels will generate credits.
Project-based Crediting – Projects include actions to reduce GHG emissions in the petroleum supply chain. This may include innovative crude – crude oil produced using methods like solar-generated electricity, refinery investment credits, renewable hydrogen used in refining, and carbon capture and sequestration (CCS) using direct air capture. Crediting for projects is based on life cycle emission reductions and credits are issued after the reported reductions are verified. This option can be leveraged to replace utility usage such as electricity and hydrogen from high CI sources to low CI sources. There are currently projects in California Kern county that are installing photovoltaic solar panels and battery storage to replace the electricity usage by oil refineries. For electricity, this reduces the GHG emissions from the grid source of 93.75 gCO2e/MJ to 100% zero-CI source solar electricity of 0 gCO2e/MJ. These projects are economically viable with the government credits and are a way of reducing the carbon intensity of existing facilities and essentially partially electrifying the existing fuel system and fleet.
Zero Emission Vehicle (ZEV) infrastructure (Capacity-based) Crediting – Introduced in 2018, crediting for ZEV infrastructure is based on the capacity of the hydrogen station or electric vehicle (EV) fast charging station less the actual fuel dispensed. This option is an “infrastructure credit” aimed at promoting building out ZEV infrastructure while providing an incentive to receive credits.
Applying for any of the above crediting programs requires registering the facility with CARB. There are essentially two main portals used to participate in the LCFS program and can be found on the CARB website.
LCFS Reporting Tool (LRT) and Credit Bank & Transfer System (CBTS). This portal serves the function of credit management system and annual reporting.
Alternative Fuel Portal (AFP). This portal serves the function of alternative fuel registration and CI pathway application & evaluation process.
The process of applying for a renewable CI fuel pathway and being certified for generating credits can be broken down into three categories, which essentially depend on the adoption level of the technology and CARB board experience in evaluating the process pathway. The full list of requirements for each of these categories can be found on the CARB website under the current regulation.
Look up table pathway applications is the simplest of the three and is limited to conventional fuels and simple electricity and hydrogen generation.
Tier 1 pathway applications involve processes that are more rigorous than the above, but the technology is generally industry adopted and CARB board has experience in evaluating the technology.
Tier 2 pathway applications involve processes that are upcoming technologies, and the CARB board has limited experience in evaluating. More rigorous review and documentation is generally associated with this pathway.
Tier 1 and 2 pathway applications require a life cycle analysis of the transportation fuel, which employs the use of the Argonne National Laboratory Greenhouse gases, Regulated Emissions, and Energy use in Technologies model (GREET model). This is a rigorous analytical tool that simulates the energy use and emissions output of various vehicle and fuel combinations. This analytical tool can be used to determine a refiner’s overall CI score of the transportation fuels and potential reductions in CI score for implementing renewable fuels into the transportation fuel pool.
The demand for transportation renewable fuel in the United States is mainly driven by policies as mentioned above per the RFS and LCFS programs. The RFS program drives renewable fuels production based on a volume mandate and incentivizes producers around the nation to generate valuable RIN credits as supply for regulated parties to purchase. On the same notion, the LCFS program drives renewable fuels and energy usage based on a carbon mandate and incentivizes zero emission sources using the CI score.
In the U.S., the RFS RIN program requires that refiners and importers of gasoline and diesel fulfill a renewable volume obligation (RVO). Entities within the U.S., as well as foreign entities, may be able to participate in the RFS RIN program by producing renewable fuel to blend and/or generate credits to sell so that obligated parties can fulfill their RVO requirements to meet compliance. The program mandates obligated parties to a required RVO annually, and they must either incorporate renewable fuel and generate RIN internally or purchase RIN on the market.
The Renewable Fuels Association reports that some refiners did in fact take steps to increase their renewable fuel blending capacity and capture RINs internally. Meanwhile, other refiners refused to invest in biofuel blending capacity, choosing instead to purchase RINs from parties who blended more than required.
The RVO to regulated parties will increase annually per the RFS EPA Volumes that can be found on the EPA website. The deficit incurred by obligated parties is set to increase until 2023 and possibly beyond 2023 subject to EPA’s decision.
In the U.S., the market for carbon credit programs is currently limited to California and Oregon. Other states are considering the LCFS program, which can open up the market for incentivizing more credit demand. Additionally, Canada is planned to have a nationwide Clean Fuel Standard in effect by end of 2022 which will open up a large market. Producers of credits outside of these carbon mandated states can opt into the program and sell valuable credits for regulated parties within these mandated states.
“Stillwater estimates that nearly 75% of all credits generated in both states [California and Oregon] are from fuels brought in from other states or countries. The value of these credits from fuels produced out-of-state in 2019 was more than $2.1 billion in California and nearly $140 million in Oregon.”
The U.S. government and armed forces are using a wide range of renewable fuels and has continued interest in exploring new technologies and different types of renewable fuels, but there is minimal use of renewable fuels due to availability.
The U.S. Navy's objective is centered around energy security, energy efficiency, and sustainability while remaining a power on the seas. In 2014, renewable fuels were included in the U.S. Navy’s fuel procurement request for the first time in history. The U.S. Navy's interest in renewable fuels was part of its goal to generate 50% of its energy from alternative sources by 2020. In particular, the Navy’s interest is in renewable fuels that can be used as direct replacements for petroleum-based gasoline and distillate fuels, also known as drop-in biofuels. The Navy also sailed the Great Green Fleet in 2016 to demonstrate the sea service’s efforts to transform its energy use. Deployed on alternative fuels, this fleet brought awareness to the Navy’s initiative to usher in the next generation of energy innovation. The Great Green Fleet was fueled by nuclear power for the carrier and a blend of renewable fuel made from beef fat and traditional petroleum.
The U.S. Air Force uses over 2.4 billion gallons of jet fuel annually (0.16 million BPCD as compared to total U.S. commercial airline demand of 1.2 million BPCD) and they are the largest energy consumer in the Department of Defense. Since 2012, the Air Force had approximately 256 renewable energy projects, but appears limited to installation of near zero emission electricity generation. The projects include solar, wind, geothermal, and waste to energy. With a 1.2 million BPCD of annual commercial jet fuel consumption, a government mandate in the jet fuel industry would further drive the demand for renewable fuels in addition to the current diesel and gasoline renewable fuels.
In theory, any carbon-based biological material from a renewable source can be a feedstock for the renewable fuels market. In reality, not all renewable feedstocks can be processed equally. Currently, the most easily processed feedstocks in the renewable fuel markets are from vegetable and seed oils, animal fats, and other used oils. Vegetable and fatty acid oils are polar compounds and typical non-polar petroleum thermodynamic predictions are not applicable. More importantly, all of these feedstocks contain glycerol (an organic compound in the alcohol family with 3 hydroxyl groups) or glycerides (an ester formed from the reaction of one or more of the glycerol hydroxyl groups with a fatty acid chain). The fatty acid chain(s) on the glyceride may be either unsaturated or saturated and results in a predictable chemical profile for refiners to process. Products from the hydrotreating of the renewable oils are linear hydrocarbons which conform to standard non-polar petroleum thermodynamics.
Feedstocks such as yard waste or other woody plant material contain cellulosic content that provides structure to plants (cellulose, hemicellulose, or lignin). These are more difficult to process and have much lower yields than the glyceride-based biomass. In this case, producing any biofuel requires a two step process, first to break down the rigid outer structure of the plant cell wall, then upgrading to finished product.20 The deconstruction step can be achieved by way of pyrolysis, gasification, or by use of enzymes or catalysts.
The quality of vegetable, seed, and fatty acid oil based feeds is remarkably consistent due to the glyceride content of each. While all glycerides contain the glycerol backbone, mono-, di-, and triglycerides are defined by the number of fatty acid chains on the ester groups. The fatty acid chains on the glycerides are defined by carbon number and olefin number, XX:Y. For example, lauric or dodecanoic has 12 carbons and no olefins, 12:00. Oleic or cis-9-octadecenic has 18 carbons and one olefin bond per chain, 18:01. A triglyceride consists of three fatty acid chains with each chain having the carbon number shown in the formula.
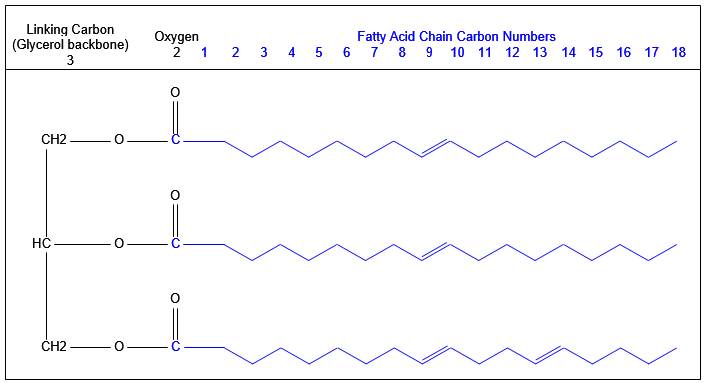
The molecular weight (MW) of triglycerides is high, 800 to 900, many with boiling points >1,000°F (538°C). On the other hand, the single chain fatty acids have MWs of 200 to 250.21 The molecular weight is calculated by understanding the molecular structure of each of the glycerides. Each glyceride is a unique molecular composition of repeating chains. The MW of individual glycerides of composition XX:Y is calculated by carbon number.21 The glycerides are a series of increasing carbon numbers and chain combinations. For example, corn has three glyceride chains each typically consisting of 54 w% linoleic, 28 w% oleic,13 w% palmitic, 2 w% steric, and 3 w% others. The chains are linked together by 3 carbons, 5 hydrogens. The calculated MW of corn ranges between 865 to 880 depending on the concentration of the glyceride distribution. The average corn molecular structure is shown in Figure 8 below:
Figure 8: Average Corn Molecular Structure
Typical value used for design; actual values may vary
Renewable feeds are primarily comprised of carbon, hydrogen, and oxygen. Sulfur and nitrogen contents are not routinely reported and are believed to be low < 100 wppm for vegetable oils and potentially higher for animal fats and waste cooking oil. The elemental analysis reported for the above feeds was calculated using the glycerides distribution and the carbon/hydrogen/oxygen composition of each. Because diesel specification does not set an initial boiling temperature, renewable diesel can accommodate the entire boiling point range for the fatty acid carbon chains noted in the glycerides distribution shown in Table 7 above, making it an ideal liquid fuels product for these feedstocks. Methods have been developed for calculating the thermodynamic and other properties required for design.
Virgin vegetable oil feedstocks provide a more consistent feedstock versus used cooking oil, which will have greater variation in contaminants. Vegetables have high concentrations of unsaturated fatty acids such as linolenic (18:03), linoleic (18:02), and oleic (18:01), whereas animal fats have more saturated fatty acids than vegetable oils, such as stearic (18:00) and palmitic (16:00). This has implication with respect to processing requirements for conversion to fuels. In general, more preprocessing will be required for higher contaminant feedstocks. Higher concentrations of unsaturated fatty acids will have higher hydrogen consumption for processing when compared to feedstocks with lower fatty acid content. Consideration of feedstock pretreatment should be a major focus of any renewable project.
Soybean is the largest source of biomass based diesel in the U.S., whereas rapeseed provides the lion’s share of feedstock for the rest of the world.27 The primary driver for the high use of soy in the U.S. is the need for protein meal for livestock. The protein meal’s coproduct soybean oil is sold as renewable feedstock. Unsurprisingly, the share of soybean oil utilized for biodiesel and renewable diesel in the U.S. has been steadily increasing over the years, reaching about 30% of total domestic soybean oil consumption of approximately 23-24 billion pounds consumed in 2018.28 With demand for both livestock feed and renewable fuels expected to increase in the next decade, soy planting is expected to rise accordingly, resulting in a continued source of soybean oil for renewable diesel feedstock in the United States.29 According to the U.S. Energy Information Administration (EIA), renewable diesel production capacity in the U.S. is on the order of 400 million gallons per year (26 thousand BPCD or 124 m3/m), U.S. renewable diesel consumption was over 900 million gallons in 2019 (21 million barrels or 3.4 million m3), and total diesel consumption in the U.S. (conventional and renewable) was about 47 billion gallons in 2019. Combined with the rising demand for renewable fuels, and increasing production capacity, it is likely that the demand for soybean oil and other renewable feedstocks may outpace the supply.
The future of renewable feedstocks largely focuses on non-food sources that are high in oil content, though emerging technologies are looking to expand the feedstock sources to include plant matter with lower oil content. The list of potential future feedstocks as of early 2021 is long, including microalgae, macroalgae, wood pulp, and others, which are generally classified as dry or wet feedstocks. From the U.S. perspective, considerable investment has been focused on algal biomass. The Department of Energy (DOE) estimates that the U.S. can produce 104-235 million metric tons of algal biomass and can do so sustainably and economically. In turn, this could yield 10-27 billion gasoline gallon equivalents (GGE) of algal biofuels annually, assuming productivity and fuel yield targets are achieved.30 GGE is a measure of how much alternative fuel is required to give the equivalent energy content of one gallon of conventional gasoline. The DOE’s Bioenergy Technologies Office (BETO) has targeted $3 per GGE pricing on technologies by 2022 and $2.5 per GGE by 2030.31
From a cultivation standpoint, microalgae are a potential source for renewable fuels; however, the technology has significant hurdles to make it economically feasible. On the plus side, algae have a high oil level and farming it does not require arable land. However, in addition to harvesting and transport logistics which require consideration, the product fuels depend heavily on the composition of the algal biomass, which in turn varies based on the type of algae, the nutrients they consume, and the environment in which they are grown. Various U.S. federal agencies such as the DOE, USDA, NOAA, and NSF are invested in researching increased algal biomass productivity and product yield.30
Perhaps the biggest hurdle for microalgae as a viable biofuels feedstock is the amount of nitrogen and phosphorus required for sufficient algae production. The amount of fertilizer required to meet a mere 5% of U.S. fuel demand would amount to more than double what’s used domestically to grow food.32 Since fertilizer components (nitrogen, phosphorous, and potassium mainly) are undesirable in finished fuels, they are generally removed by the refining process. The current focus on recycling these nutrients means the algae feedstocks of the future would require only a fraction of the fertilizer that conventional wisdom tends to quote. In addition, marine macroalgae would not require any man-made fertilizers.
The rapid growth rate (2-3 ft or 0.6-0.9 m per day) of marine macroalgae, commonly referred to as kelp or seaweed, and relative ease of cultivation as compared to microalgae may result in an overall lower production cost per barrel of biocrude produced despite lower yield results from preliminary studies. Biocrude is a mixture of hydrocarbons, fatty acids, esters, phenolics, and oxygenates that results from the conversion of biomass via chemical processes to liquid biofuel. Though the term is sometimes specific to the liquefaction process products, it is often used interchangeably with bio-oil, which is more often associated with the product of biomass pyrolysis. Marine macroalgae requires no fertilization, as cold ocean water provides the nutrients required for growth. The west coast of the United States in particular is well suited for macroalgae cultivation, as water conditions suitable for growth exist from Alaska to Southern California.33 While most of the global aquaculture production for macroalgae occurs in Asian waters,34 the United States has recently invested in research into offshore macroalgae production.
Several technologies are in development for converting biomass to renewable fuels. The DOE’s BETO office has placed emphasis on technologies that can process or co-process multiple different feedstocks to ensure a continuous source of biofuels. This minimizes the impact of variables such as growing seasons. Besides hydroprocessing of biomass to make renewable diesel, other technologies for the production of various biofuels include systems that require dry feedstocks (pyrolysis, gasification, trans-esterification) and systems that utilize the wet feedstock (hydrothermal liquefaction, fermentation, anaerobic digestion).35 Whichever method is utilized, post processing of the biofuel product is likely required. For instance, continuous hydrothermal liquefaction has been advanced to pilot-scale by the Pacific Northwest National Laboratory,36 and has been shown to produce biocrudes for both micro and macroalgal feedstocks. The biocrude product is high in nitrogen and Total Acid Number (TAN),37 which is logical considering the feedstocks require nitrogen for growth (fertilizer). Work in these areas is evolving rapidly and they could become future renewable energy feedstock sources.
Waste plastics can also be converted into energy. Incineration of waste can be used to produce heat and steam to power turbines which can generate electricity. In 2019, the U.S. burned 12.5% of its waste to produce electricity. This does nothing to reduce GHG emissions, since CO2 is produced. Byproducts of combustion also include toxic pollutants such as dioxins, acid gases, and heavy metals, which have their own pollution control methods for mitigation.
Gasification can also be used to recycle waste plastic. The polymers in plastics are decomposed into smaller hydrocarbons which can be used as fuels or raw materials for other petrochemical products. Since gasification is done in the absence of oxygen, dioxins and furans are not formed.
Plastic pyrolysis may also be used to convert waste plastic into energy. Under the proper temperature in the absence of oxygen, the polymers can be decomposed into gasoline and diesel boiling range materials. Catalysts may also be used in the pyrolysis equipment to optimize the fuels.
Since the plastics are made from fossil fuels and the final product is CO2, it is debatable whether or not energy from plastic waste can be considered renewable. As of 2019, 16 states considered municipal solid waste as a renewable fuel source.38
On a pure volume basis, by far the largest renewable fuel stock in the United States is the ethanol that is blended into the gasoline pool. Roughly 40% of the United States corn production is converted into ethanol for gasoline,39 which is associated with a fuel ethanol production capacity of roughly 1.1 million barrels per day (17.3 billion gallons/year or 5.4 million m3/month) in the U.S. as of January 2020. Even with so much current focus on renewable distillate fuels, U.S. production capacity of biodiesel and renewable diesel lags behind at roughly 164,000 barrels per day (2.5 billion gallons/year or 793,000 m3/month) of biodiesel in 2020 and 26,000 barrels per day (400 million gallons/year or 126,000 m3/month) of renewable diesel in 2018. Further, renewable gasoline production volumes sourced from entirely renewable feedstocks are less than comparably sourced renewable diesel volumes. This is likely due to a combination of factors such as ease of conversion (renewable diesel feedstocks such as soybean oil are already in the diesel boiling range), economic incentives, fuel demand opportunity, and the already renewable ethanol component of conventional gasoline found at the pump. In the U.S. RFS program, the renewable fuels category D6 RINs (which is exclusively ethanol) is the largest volume requirement, larger than the other fuel category D3/D7, D4, and D5 RINs. Coupled with the 1990 Clean Air Act, reformulated gasoline essentially exclusively uses ethanol as an oxygenate. Most of the gasoline sold in the U.S. contains ethanol up to the maximum 10% blend volume.
Government programs (both EPA RFS and California LCFS) are set up so that credit opportunity exists for renewable gasoline production. As of 2021, the RFS program includes approved pathways for producing renewable gasoline from cellulosic feedstock and renewable naphtha from limited plant oil feedstock, such as distillers corn oil and distillers sorghum oil. The California LCFS program is set up such that lower carbon intensity pathways generate more credit. That means a process producing renewable gasoline with a low CI score from all forms of technology may be considered for credit generation.
The renewable fuels industry has shown much interest in renewable gasoline in different forms of production. Studies have been conducted for using a Fluid Catalytic Cracker (FCC) to take feed of plant oils or co-processing pyrolysis oil with vacuum gas oil, allowing for re-use of a refinery asset for renewable gasoline production. Projects with Fisher-Tropsch technology are currently in operation, in construction, and planned for future construction. Shell’s Pearl gas-to-liquids plant in Qatar was built and operating since 2011, while Nacero announced in Q2 2021 that they are planning a gas-to-liquids plant in Texas using several other technologies to reduce carbon footprint.
Some momentum has started for 100% renewable gasoline into commercialization as of 2021, but is dwarfed by the current government program for ethanol production. The future of commercialized mass renewable gasoline production may depend on government incentives beyond that of the existing RFS.
Ethanol has been a major fuel constituent in the transportation fuels sector dating back to the 1970s. Most of the gasoline sold in the U.S. is blended with some amount of fuel ethanol, with E10 gasoline blend being the most common. The ethanol use in gasoline blending was significantly boosted by both the EPA RFG and RFS program starting in the early 2000s. The goal of the EPA RFG program was to achieve cleaner burning gasoline with oxygenates, while the EPA RFS goal is to increase renewable fuel use. By 2011, most gasoline-powered engine in the U.S. could use E10 gasoline, but higher ethanol blends result in significant decreased fuel economy. This is mainly due to the energy content of ethanol having 67% of the energy content of gasoline. The tradeoff of E10 gasoline is a slight decrease of about 3% in fuel economy while achieving cleaner burning fuel and sourcing from renewable. Additionally, only specific types of vehicles can use gasoline blends higher than 10% due to corrosion issues at high ethanol content.
While synthetic (non-renewable) ethanol exists, the vast majority of ethanol is sourced from a variety of agricultural feedstocks, primarily corn in the U.S. and sugarcane or sugarbeets elsewhere in the world40 and is thus considered a renewable fuel additive. Ethanol from renewable sources has been mainly driven by the RFS program. Recall that the RFS program requires a minimum amount of renewable fuels to be blended into transportation fuels, with that minimum increasing each year. Ethanol is an obvious choice to meet this requirement due to its high octane properties and renewable feedstock sources. The RFS plan was based on the idea that as gasoline consumption increased alongside the increasing minimum renewables requirement, the national fuel supply could stay at or below the E10 blend wall, or the maximum ethanol blend to avoid engine or fuel system damage in vehicles not designed for fuel past E10 grade,41 which includes most vehicles on the road today. EPA suggests that gasoline consumption in recent years has been close to the E10 blend wall level. From 2015 through 2019, fuel ethanol consumption equaled about 10% of total U.S. motor gasoline consumption.
As gasoline consumption is likely to decline as a result of increasing remote work options and increasing popularity of electric vehicles, the U.S. is on track to hit the ethanol blend wall. Possible solutions to the blend wall problem include adjusting the RFS rules, which would require a change to government regulations, changes to the way engines and fuel systems are made, increased production of E15 and E85 gasoline, neither of which helps cars already on the road, or finding another renewable oxygenate to use instead of ethanol.
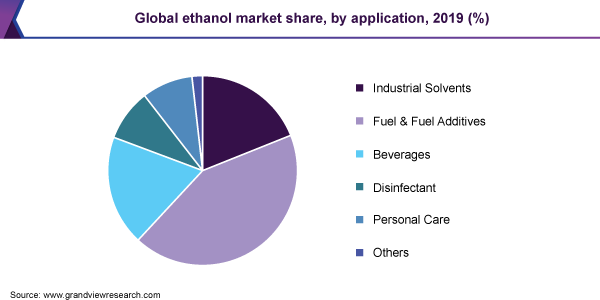
In a future scenario where electric vehicles make up automotive market share and market demand for gasoline declines, the use of ethanol in gasoline would also decline as a majority of ethanol used today is for the purpose of blending into gasoline. In 2019, ethanol use in fuel & fuel additives had a market share of approximately 43% (see Figure 9). There remains opportunity for ethanol and ethanol producers to shift assets into relevant markets in fuel and chemicals.
Figure 9: 2019 Global Ethanol Market Share
The demand for gasoline as a transportation fuel is seen on a path of decline with increasing policies and interest to adopt zero emission vehicle (ZEV) powertrains. This decline in gasoline demand is expected to be seen in the near-term, affecting light and medium-duty vehicles. While the U.S. has some states that have adopted ZEV and low-emission vehicle regulations, no federal legislation is currently in place. However, California has recently announced executive orders that will aggressively push the market into ZEV. California will require all new passenger cars and trucks sold in the state to be emission free by 2035. In addition, California will also require all semi-trucks sold in the state to be emission free by 2045.
Ethanol producing plants may face business decisions in a changing market where ethanol demand in gasoline diminishes. This leaves ethanol producers to consider unconventional market opportunities such as other transportation fuels or chemicals. As light and medium duty passenger vehicles are the primary focus of ZEV powertrains, ethanol could be a feedstock to produce renewable diesel and SAF while capturing government incentive programs in transportation fuel. There are several companies that recognize this opportunity in the current market landscape and have positioned themselves as technology owners.
Gevo, a Colorado based company, has a commercial facility making isobutanol alongside ethanol and produces it using a genetically modified yeast. They have also been producing alcohol-to-jet (ATJ) derived from isobutanol since 2011 at South Hampton Resources located in Silsbee, TX. Gevo’s ATJ fuel was used in certification tests, including test flights with the U.S. Air Force, U.S. Army, and U.S. Navy. Since receiving its ASTM certification in 2016, Gevo’s ATJ fuel has been used in commercial flights around the world and working towards commercialization.
Vertimass, a California based company, is developing a proprietary catalyst for converting ethanol into renewable diesel, SAF, and renewable chemicals. As of 2017 they have several pilot plants as proof-of-concept and continuing improvements and development with a target to commercialization.
Other opportunity exists in the chemical industry. Axens has a dehydration technology of converting renewable ethanol into bio-ethylene. The bio-ethylene produced can be integrated in existing downstream polymerization installations such as polyethylene (PE), polystyrene (PS), polyethyleneteraphthalate (PET), polyvinylchloride (PVC) and acrylonitrile- butadiene-styrene (ABS) without need for modifications.
Zero emission vehicles (ZEV) have proven to be a reliable alternative to the internal combustion engine in today’s market. Electric motor vehicles have taken the center stage as the alternative powertrain technology. Electric battery packs as the source of energy are on a path to price parity with internal combustion engine cars. The near-term expectation of light and medium-duty transportation vehicles is a shift to zero emission vehicles. This would lead to the decline of demand in gasoline fuel as more ZEVs are adopted. However, as discussed above, today’s electricity is largely generated from fossil fuel sources. Until the grid has turned over to be renewably sourced, renewable liquid fuels are a viable alternative for GHG reduction during the transition. Renewable liquid fuels are also the only pathway for the existing ICE fleet.
The current U.S. government mandates on renewable gasoline are limited to the RFS and LCFS programs. Even though ethanol blending began with the Clean Air Act for the purpose of reducing smog and harmful toxins, it is the RFS program that mandates blending 10% ethanol into conventional gasoline pool, which coincides with the program’s Renewable Volume Obligations (RVO) to refiners. Technology exists to produce renewable gasoline, and complies with the RFS program, but is not widely industry adopted as of 2021. The state level LCFS program mandates a carbon reduction via a credit market, putting lower carbon intensity score produced gasoline in favorable position for selling credits to deficit producers. This program is designed to incentivize lower intensity score renewable fuel processes. Ethanol producers can generate credits in this market to sell, but the program does not necessarily drive the mandate for ethanol nor any other type of sustainable process.
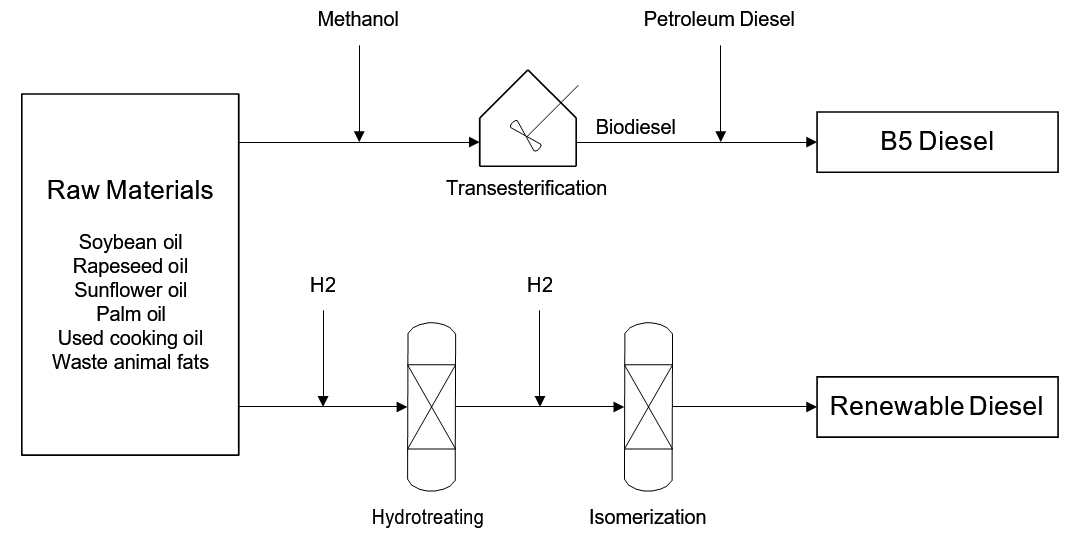
Biodiesel and renewable diesel are both made from renewable resources. However, they are not the same. Biodiesel is made by transesterification of a glyceride with an alcohol. 100% biodiesel cannot be used directly in unmodified vehicles because biodiesel retains the oxygen from the glyceride’s ester group after the transesterification process. Biodiesel is not chemically the same as conventional diesel, and does not meet diesel cold flow property specifications. Blending with petroleum-based diesel in mixtures up to 20% allows the biodiesel to meet engine fuel specifications. Renewable diesel is made by hydroprocessing of glycerides, producing a fuel that is fully fungible with conventional diesel, but is more expensive to produce.
Figure 10: Biodiesel and Renewable Fuels Production
Biodiesel is made by transesterification of glycerides found in the feedstock oils. The transesterification reaction is the process by which glycerides and alcohol – most commonly methanol – are converted into alkyl esters. The reaction is catalyzed by a strong acid or base. Industrial scale processes commonly use sodium or potassium methanolate.42 The products of transesterification of glycerides with methanol are fatty acid methyl ester (FAME), or biodiesel, and glycerol.
Biodiesel cannot be used directly in most vehicles and typically has to be blended with petroleum diesel. Up to 5% FAME (B5 biodiesel) is allowed by many vehicle manufacturers with some that can accommodate up to 20% FAME (B20 biodiesel). Biodiesel has different solvent properties from petroleum-based diesel. Impurities such as methanol, free fatty acids, water, catalyst and glycerol left in the biodiesel may increase corrosion,43 causing degradation of rubber gaskets and hoses in vehicles. The cold flow properties of biodiesel vary depending on the feedstock but are generally worse than both petroleum based and renewable diesel. These cold flow properties make biodiesel unusable in cold climates without blending with petroleum diesel or additives. Table 8 below shows a comparison of cold flow properties of biodiesel from various feedstocks and No. 2 petroleum diesel.44
Table 8: Biodiesel Cold Flow Properties
Soy
Canola
Lard
Edible Tallow
Inedible Tallow
LFFA (1) Yellow Grease
HFFA (2) Yellow Grease
#2 Diesel
Cloud Point, °F (°C)
36 (2)
27 (-3)
57 (14)
68 (20)
73 (23)
108 (42)
46 (8)
0 (-18)
CFPP, °F (°C)
28 (-2)
24 (-4)
52 (11)
58 (14)
50 (10)
52 (11)
34 (1)
-4 (-20)
Pour Point, °F (°C)
30 (-1)
25 (-4)
52 (11)
56 (13)
46 (8)
54 (12)
46 (8)
-17 (-27)
Kinematic Viscosity @40°C, cSt
4.55
4.63
4.85
4.91
4.93
5.62
4.66
2.45
Notes:
LFFA – Low Free Fatty Acid
HFFA – High Free Fatty Acid
The byproduct of biodiesel production by transesterification is glycerol. Glycerol can be used in the food and cosmetic industries. Anaerobic digestion of glycerol can also be used for methane production and power generation.
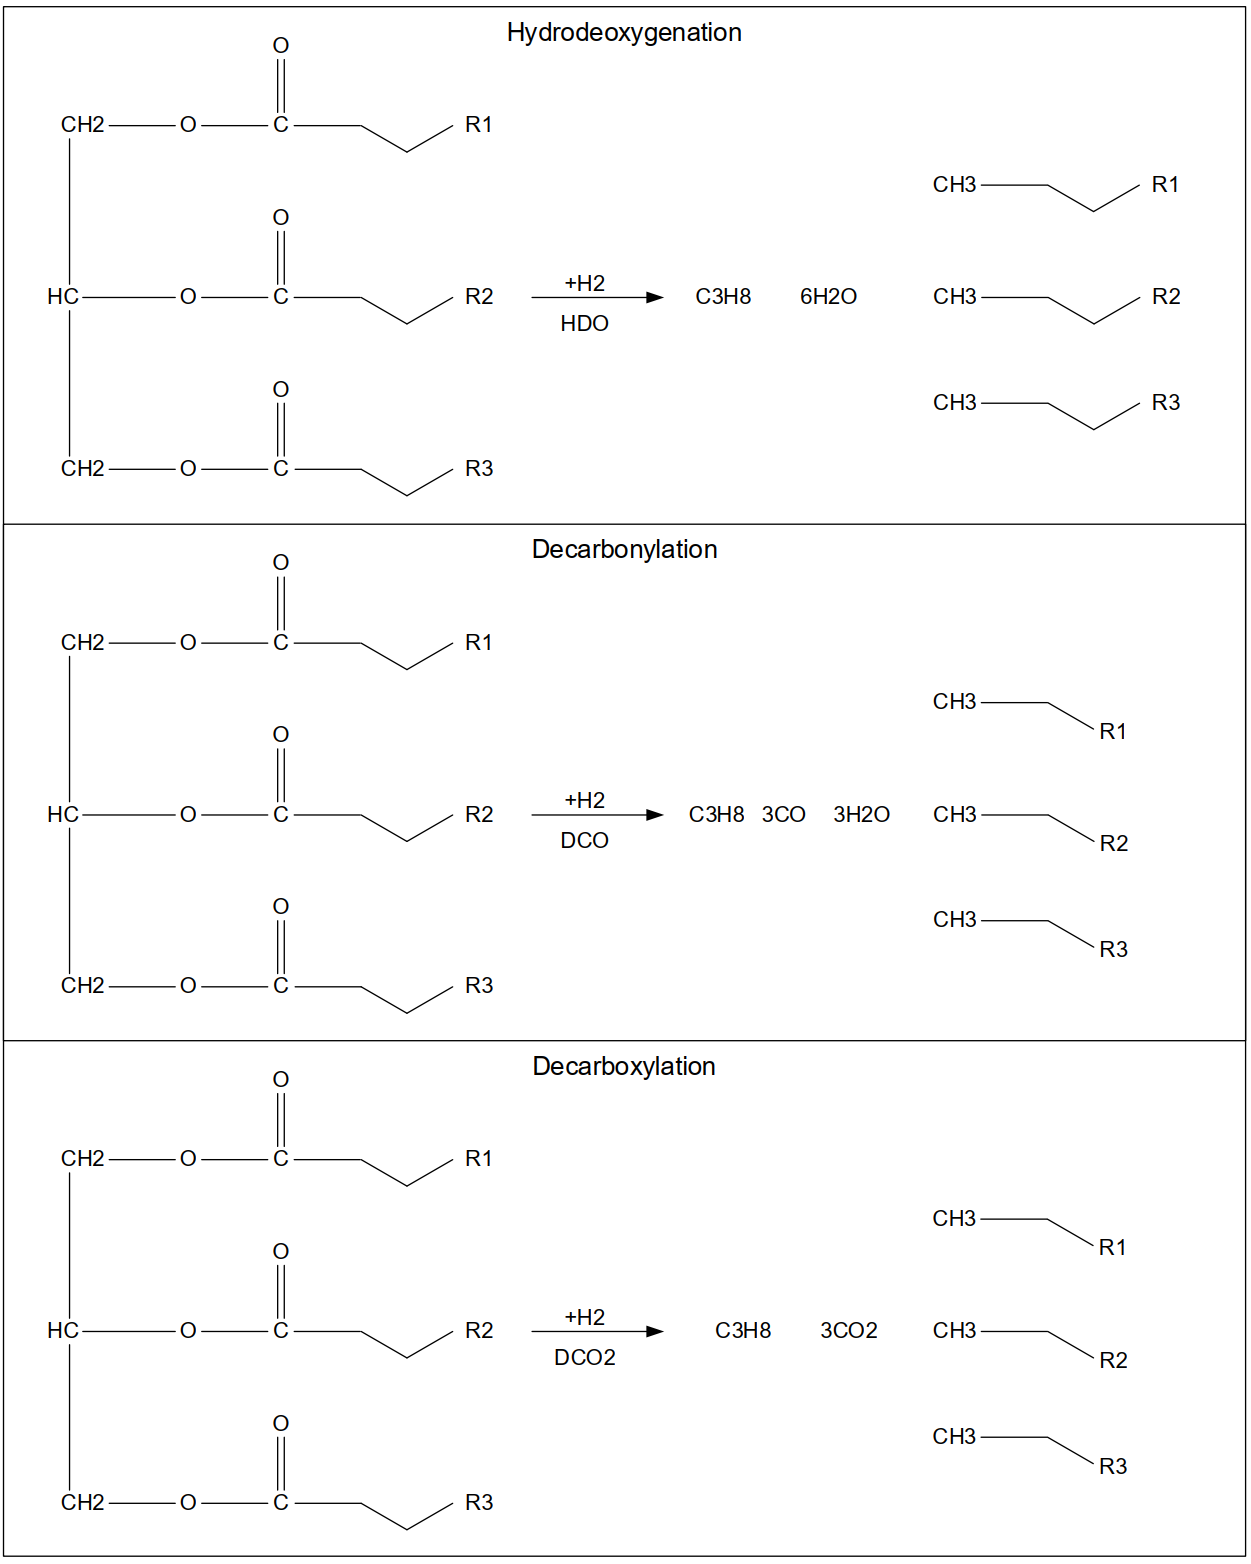
Renewable diesel uses the same raw materials as biodiesel but processing is by more typical refining processes. Feed glycerides are remarkably consistent between feeds with the difference being the concentration of individual carbon chains. The olefins in the glycerides are saturated and deoxygenated by adding hydrogen and processing over hydrotreating catalyst. The products of the hydrotreating reactions, including possible side reactions of reverse water gas shift and methanation, are straight chain paraffins, water, methane, propane, CO2, and CO. The water and gases are separated from the hydrotreating effluent. The paraffinic stream is sent to an isomerization reactor to improve cold flow properties. Additional details about the reactions can be found in the Reactions discussion under the Existing Refinery Retrofit section.
Yield of liquid fuel from the hydroprocessing of renewable feedstocks is reasonably good, roughly 75-80 wt%. Assuming a generic triglyceride with a carbon chain of 18 carbons, 1.2 olefin bonds per molecule, and an O2 content of the mixture at 11%, theoretical yields are estimated in Table 9 below.
Table 9: Biodiesel Cold Flow Properties
Generic Yields from the Chemistry Basis: the entering triglyceride as a wt%
Hydrogen consumption
3 to 4
Most of hydrogen consumed in deoxidation reactor
Water
11 to 13
Water produced in deoxidation reactor
Methane
3 to 6
Can be higher, depending on severity of isom reactor
Diesel + Jet + Gasoline
75 to 80
Selectivity to diesel is a function of reactor and catalyst
While the hydroprocessing of glycerides to make renewable diesel is a similar process as that of diesel hydroprocessing, there are a few key differences. Production of renewable diesel requires substantially higher quantities of hydrogen. Conventional petroleum hydroprocessing requires 300-1100 SCF/BBL for diesel hydrotreating and 1500-2500 SCF/BBL for gas oil hydrocracking, while renewable diesel production requires 1800-2400 SCF/BBL dependent on feedstock of virgin plant oil or animal fats. In addition, ensuring the proper operating conditions and catalyst will minimize the side reactions, which will improve the yield of diesel. Additional discussion on refinery considerations for producing renewable diesel may be found in the Existing Refinery Retrofit discussion.
There are other technologies available for renewable diesel from biomass. Gasification of feedstocks is another path for producing renewable diesel. The biomass can be gasified by microbial digestion or pyrolysis. The gas can then be processed using Fischer-Tropsch synthesis to convert the gas to diesel and naphtha. Fast pyrolysis uses heat in an air free environment to decompose the large biomass molecules to diesel and naphtha boiling range materials. These can be processed to diesel or other fuels.45
Renewable diesel that is produced from hydroprocessing methods meets ASTM D975 properties and is considered the same as conventional diesel fuel. This is typically done with the industry adopted hydrotreating process of first hydrodeoxygenation followed by hydrocracking/isomerization. There are many vendors that offer licenses for this process discussed in the Hydroprocessing Technology discussion under Renewable Process Technologies. Ascent has extensive modeling and refining experience that would help a refiner select the best fit licensor given their unit and refinery configuration. Ascent could also assist with non-licensed options. The renewable diesel produced from this process satisfies CARB diesel, with zero aromatics and a high cetane number. The paraffinic nature of the fuel results in good fuel stability due to the lack of olefins. The high cetane number means renewable diesel is a high performance fuel. Cloud point is a key product quality parameter due to the paraffinic nature of the product and is controlled by the ratio of normal to iso-paraffin. The U.S. specification range is -35°C (-31°F) for winter or artic diesel to -9°C (16°F) for summer diesel.
Co-products in the production of renewable diesel include naphtha, jet fuel, and fuel gas. The naphtha is a low-octane gasoline and is of less value than the diesel or jet fuel, though it is considered a “green” fuel and has potential for credit capture. Renewable jet fuel has no U.S. federal mandates at this time, but renewable jet producers can sell RIN credits in the RFS program or carbon credits in the LCFS program. Fuel gas that is produced from renewable feeds can also be considered “green” fuel.
Diesel internal combustion engines are facing a growing interest in the alternative motor powertrain. Currently, the market of focus is in Class 7 and 8 heavy duty trucks. Some companies also have long term plans for construction vehicles as well. The expectation is that the development and adoption of ZEVs as an alternative to diesel internal combustion engine is long term. The relevance of diesel as a transportation fuel will remain a market opportunity in the near future.
The current U.S. government mandates on renewable diesel are limited to the RFS and LCFS programs. Some states offer a diesel tax credit and the federal government offers a Blenders Tax Credit (BTC), but it is subject to periodic review and renewal and should not be relied on for long term credit incentive. The RFS program mandates a Renewable Volume Obligation (RVO) on several types of renewable diesel produced from sustainable sources into the nation’s diesel pool. The state level LCFS program mandates a carbon reduction via a credit market, putting lower carbon intensity score produced diesel in favorable position for selling credits to deficit producers.
Renewable Jet Fuel, known as Sustainable Aviation Fuel, or SAF, is made from renewable feedstocks and provides a net reduction in greenhouse gases across its life cycle as compared to petroleum-based Conventional Aviation Fuel (CAF). Technology exists to create SAF that is of 100% “drop-in” quality, meaning it can be used as jet fuel without requiring modification to either the engine or the fuel system and without requiring a blend in order to meet ASTM specifications. However, SAF is not produced in a large enough scale to meet the demand for global jet fuel, and production remains more expensive than conventional,46 so it is regularly blended with CAF for use. The blending amount of SAF into CAF is set by the Federal Aviation Administration (FAA). The blending amount can range from 10% to 50% depending on the type of SAF-approved fuels pathway. When SAF is blended with CAF, the SAF-approved fuels are considered fully fungible as an ASTM D1655-approved fuel. Hence, approved fuels with SAF are not treated differently than current fuels from petroleum, making use of existing airport infrastructure.
Unlike gasoline, with specifications that vary depending on location, climate, time of year, and local environmental regulations, jet fuel must meet a set specification. The fuel must remain consistent to the standard, without requiring adjustments to the engine or fuel system and without requiring blending. Additionally, since the primary customers are large airline corporations, jet fuel contracts are often negotiated to purchase large amounts of fuel at a set price,46 leaving little room for supply or production issues that can cause disruptions in price. Any fuel that is not “drop-in” capable runs the risk of safety hazards associated with mishandling and/or may require additional infrastructure for blending and confirming that it meets the standard, all of which would drive up the cost of the fuel.
The Federal Aviation Administration (FAA) specifies that all certified engines and aircrafts must operate a fuel specified by American Society for Testing and Materials (ASTM). As of 2021, the FAA and ASTM currently have seven approved pathways to produce drop-in SAF, each with different feedstocks and/or processes to produce the jet fuel. The approved pathways have some variations within the technology, but the primary conversion methods can be summarized as follows:47
HEFA, Hydroprocessed Esters and Fatty Acids:
In the HEFA-SPK (Hydroprocessed Esters and Fatty Acids, Synthetic Paraffinic Kerosene) process, approved in 2011, lipid-based feedstocks are deoxygenated using hydrogen and then hydroprocessed into hydrocarbon products. In 2020, the similar HC-HEFA (Hydroprocessed Hydrocarbons, Hydroprocessed Esters and Fatty Acids) process was approved to use lipids from algae as a feedstock. These are the most like traditional crude refining.
FT, Fischer-Tropsch:
This was the first approved pathway for a straight paraffinic SAF and is produced by gasification of solid biomass feedstock into a syngas, which is converted to liquid hydrocarbon by the FT process. Later, a second FT process was approved that produces SAF with aromatic compounds.
SIP, Synthesized Isoparaffins:
This is a fermentation based process that utilizes sugars as a feedstock, converts it to farnesene, and is then hydrotreated to produce SAF.
ATJ, Alcohol-to-Jet:
This process upgrades isobutanol or ethanol to SAF by oligomerization. The source of alcohol feedstock is not specified, but the pathway commonly starts fermentation of a sugary feedstock to the intermediate alcohol.
CHJ, Catalytic Hydrothermolysis:
The CHJ process, also called Hydrothermal Liquefaction, combines fatty acid with water and passes them into a high temperature and high pressure reactor to create a single phase that is then hydroprocessed to produce SAF.
The two HEFA pathways noted above are the most similar to traditional refinery hydroprocesses in that they take a renewably sourced oil-based feed and process it in ways that are familiar to a conventional refinery. This makes it a good starting place for a refiner to make the leap from producing petroleum based jet fuel to renewable jet fuel. The other pathways likewise include some level of traditional hydroprocessing, but also include an early processing step that may require heavier investment on the part of the refiner in order to achieve.
Government programs such as the U.S. EPA RFS and state level LCFS currently do not mandate a sustainability restriction to aviation fuel. However, these programs do offer SAF producers the ability to participate by selling RIN credits in the RFS program or carbon credits in the LCFS program.
The International Civil Aviation Organization (ICAO) also has an upcoming Carbon Offsetting and Reduction Scheme for International Aviation (CORSIA) program that works as a credit program, analogous to the RFS and LCFS programs. The ICAO is a consortium of 193 national governments to support their diplomacy and cooperation in air transportation. They are basically an arm of the United Nations. They set standards for international aviation industry to be widely followed, but worth noting they cannot impose those rules. In 2016, member countries of the ICAO agreed to CORSIA rules, and began monitoring CO2 emissions back in 2019 to set a baseline of emissions starting in 2020. The initial pilot phase for the credit program starts in 2021. There are 78 countries representing three-quarters of international flights have volunteered to participate in this initial pilot. This includes the U.S., Australia, Canada, Saudi Arabia, Japan, the UK and many other EU countries.
It is plausible that it may only be a matter of time before a U.S. mandate on aviation fuel occurs. At the time of this writing, there are calls for SAF support at the highest levels of government. A consortium of the aviation industry has recently written a letter to the U.S. government urging support for the inclusion of a SAF-specific blender’s tax credit. Currently, Norway and Sweden have mandated sustainable aviation fuel requirements. Norway requires all aviation fuel to contain 0.5% of renewable fuel in effect as of 2020. Sweden introduced a more aggressive program in reducing GHG emissions starting in 2021 with a 0.8% reduction and gradually increase to 27% reduction in 2030.
Companies around the world are embracing renewable fuels; many by using common, more readily available technologies and others that are developing new and less commonly used technologies and feedstocks. Ethanol in gasoline is by far the most common renewable feedstock in the United States and it is primarily made by fermentation. Biodiesel production is also well established via the transesterification of glycerides and fatty acids with alcohol. Since both ethanol and biodiesel have blending limits in the U.S. fuel pool, current research focus has been on fully fungible renewable pathways. Hydroprocessing technology has made headway into industry adoption and currently makes up most of the commercialized technology and current projects used in the production of renewable liquid diesel. Pyrolysis, Gasification, and Fisher-Tropsch technologies to process solid and cellulosic feedstocks are also concepts that are making headway into commercialization.
As new technologies are proven successful on the laboratory scale, one of the most common hurdles to mass production is scale-up of the technology into pilot plant and commercialization. These new technologies will have the opportunity to advance into commercialization as the net zero carbon initiative garners momentum. Ascent has experience and is an excellent partner in these transitions from pilot plant to commercial scale facilities.
There are over 200 ethanol plants and nearly 100 biodiesel plants already established and operating in the United States. Additionally, with the focus on fully fungible renewable fuels, there are more than 50 planned or operational renewable liquid fuels plants around the world, with most of the plants located in the U.S. as of Q2 2020. Of the three major liquid transportation fuels, gasoline, jet fuel, and diesel, most of the current projects are focusing on renewable diesel. There are projects for 100% renewable gasoline and jet fuel in progress in the industry, but not to the extent of 100% renewable diesel production. This is likely due to the availability of renewable diesel technology and the incentives provided by the LCFS program. Renewable gasoline and jet are clearly on the horizon, though somewhat behind the renewable diesel timeline.
The following is a list of renewable fuels plants around the world that are currently in operation or in planning stages for future construction. There is a mix of commercial projects planned, which include hydroprocessing, gasification, pyrolysis, gas-to- liquids, biogenic, or combinations of these technologies. In addition, many of these projects are incorporating utility generation from solar and other carbon net negative sources.
Table 10: Current Projects and Costs
Hydroprocessing technology is the most widely commercialized form of producing renewable diesel of drop-in quality. Feed to the hydroprocessing unit is limited to waste fats, oils, and grease. The feed must be pretreated to remove contaminants to avoid damaging and degrading the hydrotreating catalyst.
There are two main reactions that convert the feed into renewable diesel. The first reactor beds ideally perform the selective hydrodeoxygenation reaction to break down triglycerides into water and straight hydrocarbon chains. The next reactor beds or reactor perform the hydrocracking/hydroisomerization reaction to convert the straight chain hydrocarbons into isomers of smaller chains to improve physical properties, mainly pour point. The reactor effluent is then separated of recycle gas and fractionated to produce offgas, naphtha, and diesel.
There are various licensors available providing the catalyst and technology for the production of renewable diesel via hydroprocessing. Some companies have developed their own proprietary catalyst to use internally. The most widely available licensors are Axens, Haldor Topsoe, and Honeywell UOP.
Fischer-Tropsch technology is an exothermic process that combines CO and H2 into chained hydrocarbons to produce renewable fuels. The reactor temperature operates in the range of 150-350°C (302-662°F). Fischer-Tropsch technology can be utilized in a renewable fuels scheme by processing a synthesis gas generated from a renewable feedstock. There are variations of feed gas production pathways, which ideally require an H2 to CO ratio of 2. The synthesis gas produced from gasification technology is an ideal Fisher-Tropsch feed gas since the main gasifier gas product is predominantly CO and H2. Steam methane reforming to produce CO and H2 is also viable and can be further reduce carbon footprint by using renewable natural gas.
There are projects that utilize Fischer-Tropsch technology with a carbon capture CO2 feed gas discussed below. Other projects that take synthesis gas from a gasification process are discussed in the next section.
Porsche, being known as a high-performance automaker, is investing and collaborating with several energy companies to produce a carbon-neutral synthetic fuel and dubbing it “eFuel”. The pilot plant project Haru Oni is slated to be built in Chile, planned for production in 2022, and will convert methanol to gasoline. The methanol will be produced by combining CO2 and H2 and will be sustainably sourced. CO2 direct air capture will be utilized, and Siemens Energy’s PEM electrolysis powered by wind power will produce the H2.
Nacero, a Texas based company, is planning a 100,000 barrels per day (1.5 billion gallons/year or 484,000 m3/month) renewable gasoline facility in Penwell, TX. The facility will utilize a myriad of technology to minimize its carbon footprint. They will utilize Haldor Topsoe TIGAS technology to convert natural gas, captured bio-methane, and flare gas into methanol, followed by conversion into renewable gasoline and hydrogen.
Gasification is a high temperature thermal degradation process with reactor temperatures operating in the range of 750-1100°C (1382-2012°F). The key process trait of gasification is that the reaction occurs in a starved oxygen environment, known as choked combustion or incomplete combustion, so the output gas retains combustion potential. Feed to the gasification process can be biomass or solid waste, producing a synthesis gas as the main product and ash as a byproduct. The synthesis gas is comprised of CO, CO2, CH4, H2, and H2O, and serves as an intermediate feed stream in the production of renewable transportation fuel. There is some flexibility in the final product, as the synthesis gas can be further processed in other technologies to produce ethanol, biodiesel, wax, or paraffins.
Gasification technology has been proven commercially and is deployed around the world by the chemical, refining, fertilizer, and electric power industries. Besides the traditional non-carbon-neutral coke and coal feedstocks, most of these gasifiers are also able to use biomass or solid waste feedstocks, which is important to a renewable fuel producer because cellulosic feeds offer the highest reduction GHG emissions and a high value in government credit programs.
There are several companies with planned commercial scale productions employing a combination of gasification, Fischer-Tropsch, and hydroprocessing to produce fuels.
Fulcrum Bioenergy, a California based company, developed a process that combines gasification technology with Fischer-Tropsch fuel process to produce renewable synthetic crude. They are completing construction of their first facility planned for operation in 2021. The Sierra BioFuels Plant is located in Storey County, NV and expected to process 175,000 tons of municipal solid waste feed stock annually to produce 11 million gallons (700 barrels/day or 3,500 m3/month) of renewable synthetic crude. Fulcrum has an offtake agreement with Marathon Petroleum Corporation (MPC) to sell all of the synthetic crude to MPC’s refinery in Martinez, CA. Included in the project is a feedstock processing facility located near a large waste landfill, which has been commissioned and started-up and is producing gasification feed from sorted municipal solid waste.
Northwest Advanced Bio-Fuels, an Arizona based company, has a technology to convert woody biomass into SAF. The process combines a front-end gasification process and a back-end Fischer-Tropsch process. They are planning to build a commercial plant at the Port of Grays Harbor, WA and have secured $600 million in funding commitment. The project will produce 60 million gallons per year of SAF (3,900 barrels/day or 19,000 m3/month) and reported a 10-year offtake agreement with Delta Airlines.
Velocys, a United Kingdom company, provides a complete end-to-end process from waste feed to fuel, and their technology has been proven extensively in pilot scale. Velocys process technology employs gasification, Fischer-Tropsch, and hydrocracking to produce SAF and renewable diesel. Velocys is currently involved in two projects that will bring the technology to commercial scale. A collaboration of Velocys and British Airways have joined in the name of Altalto to bring the process technology to Immingham, United Kingdom. A similar partnership of Velocys and Oxy Low Carbon Ventures is planning a Bayou Fuels project to bring the process technology to Natchez, Mississippi. Oxy Low Carbon Ventures expertise in carbon capture and sequestration will take the renewable process a step further by reducing CO2 emissions into the atmosphere.
USA BioEnergy, an Arizona based company, is in early stages of developing three project sites to bring their technology to commercial scale. The company provides a design that includes gasification, Fischer-Tropsch, and hydroprocessing to produce SAF and renewable diesel. As of 2018, the company has entered into a Letter of Intent to develop the project in Yell County, AR, Maricopa County, AZ, and Lane County, OR.
Red Rock Biofuels, a Colorado based company, is constructing a renewable fuels facility utilizing gasification, Fischer-Tropsch, and hydrocracking in Lakeview, OR. The facility will take waste biomass from sawmills and forests. Red Rock Biofuels has partnered with TCG Global for the gasification technology. Emerging Fuels Technology is the licensor for the Fischer-Tropsch process and Velocys has manufactured and completed delivery of four reactors in Q1 2021.
Pyrolysis is a high temperature thermal degradation process with reactor temperatures operating in the range of 400-600°C (752-1112°F). The key process trait of pyrolysis is that reaction occurs in the absence of oxygen. Feed to the pyrolysis process can be of biomass and solid waste, producing a bio-liquid as the main product and synthesis gas and char as the byproducts. The three classifications of pyrolysis are slow pyrolysis, fast pyrolysis, and flash pyrolysis, which all differ in temperature, residence time, and heating rate that varies the yield structure to maximize char or gas/liquid oil production. Maximizing bio-liquids (often referred to as synthetic bio-oil or bio-crude) is desired in the case of renewable fuel production, which typically fits in the fast pyrolysis and flash pyrolysis types. Bio-liquid is high in oxygen content and must be further processed to convert into renewable fuels. The synthesis gas byproduct is comprised of CO, CO2, CH4, H2, and various range of C2-C4 hydrocarbon and is typically recovered, cooled, treated, and flared.
Biomass pyrolysis systems have been built in small scale but have yet to be adopted in large scale to serve the energy markets.
There are a couple of well-known pyrolysis technology providers that have small scale plants built.
BTG Bioliquids, a Netherlands based company, has a fast pyrolysis technology and with two small scale plants in operation. The Empyro plant in Hengelo, Netherlands takes in a feed of wood residues to convert into bio-oil and has an offtake agreement with a nearby dairy farm. The Green Fuels Nordic Oy plant in Lieksa, Finland takes in saw-mill byproducts and biostem to convert into bio-oil and has an offtake agreement with a heating plant in Joensuu, Finland. A third installment of BTG Bioliquids technology is planned with Pyrocell, a joint venture between a wood industry company Setra and oil company Preem. The Pyrocell project is located Gävle, Sweden and construction commenced in Q1 2021.
Ensyn, a Canadian based company, holds a patented fast pyrolysis technology and with two small scale plants in operation producing bio-oil. The bio-oil from both the Ontario and Quebec facilities is supplied to heating oil customers.
A Fluid Catalytic Cracker (FCC) is a potential asset an existing refiner can use to produce renewable gasoline. Studies were conducted between 2013 and 2016 for processing bio-oil feedstock in an FCC system. FCC pilot scale tests were conducted in co-processing pyrolysis oil with vegetable oil and up to 10% pyrolysis oil with conventional vacuum gas oil. In one study by GRACE (discussed below), even 100% soybean oil was processed straight into the FCC. As of 2021, there is no record of this form of processing on the commercial scale and it remains a potential asset utilization for existing refiners.
W.R. Grace & Company (GRACE) developed a modular pilot plant FCC unit and licensed 26 pilot plant FCC units around the world as of 2013. A test study conducted in 2013 by GRACE compared 100% soybean oil feed to conventional vacuum gas oil, and preliminary results suggested that soybean oil could likely be processed in a commercial FCC. It is unclear if there are recent developments to processing soybean oil in an FCC.
More recent study work in this area has focused on co-processing of pyrolysis oil with vacuum gas oil. Researchers are examining catalysts, product properties, and overall feasibility of this process. Overall, these studies highlight challenges even with a small amount of mixed pyrolysis oil processed in an FCC, but are optimistic in the general feasibility of the process. It is unclear if there are recent developments to processing pyrolysis oil in an FCC.
Gevo, a Colorado based company, has a commercial facility making isobutanol alongside ethanol and produces it using a genetically modified yeast. Isobutanol already has a market in chemicals and in E0 gasolines (no ethanol). Compared to ethanol, isobutanol has more attractive physical properties such as lower vapor pressure, higher octane, and better energy density, making it a good candidate as a gasoline blendstock. It can also count for the RFS program if it is sourced from renewable feedstock. The isobutanol can be further upgraded to produce SAF.
An approach that has gained interest, but remains in early development stages as of 2021, is converting sugars (from derived biosources) into renewable fuels, either through catalytic or biochemical processes.
Virent, a Wisconsin based company and a subsidiary of Marathon Petroleum Corporation, owns a technology that converts plant-based sugars into a full range of hydrocarbon products identical to those made from petroleum. This includes gasoline, diesel, jet fuel, and chemicals for plastics and fibers. They are not yet commercialized but have key strategic relationships with energy companies that can support their commercialization.
A research team, led by the U.S. DOE Argonne National Laboratory in collaboration with Northern Illinois University, has discovered a new electrocatalyst that converts carbon dioxide and water into ethanol with very high energy efficiency, high selectivity for the desired final product, and low cost. The process of producing ethanol from carbon dioxide creates a circular carbon economy, which entails the reuse of carbon dioxide as opposed to releasing into the atmosphere. This is still continuing research in collaboration with industry.
LanzaTech, an Illinois based company, uses an engineered microbe to convert CO2 into ethanol in gas phase fermentation. They have 6 demonstration plants installed globally since 2008 and have commercial facilities in operation attached to industrial facilities capturing the carbon offgas streams. LanzaTech subsidiary LanzaJet provides an alcohol-to-jet technology to produce SAF and renewable diesel which has been proven on commercial scale. The primary steps to this process include dehydration of the ethanol, oligomerization, hydrogenation, and fractionation.
The addition of domestic government incentive programs complicates the economics. As of the time of publication of this work, there have not been significant government incentives put forward for renewable jet. Renewable gasoline currently exists primarily as a byproduct of renewable diesel production, and as a mandate for ethanol blending in some locations, though the value of renewably produced ethanol can be calculated in the same manner as renewable diesel. Therefore, the economics laid out in this section will be based only on renewable diesel.
The profitability of renewable fuel production can be defined as the incentive minus the investment. The investment part of this equation will be different for each producer and should be determined on a case by case basis. For the refiner, this includes feedstock and production costs as well as payments on capital investments and other inputs.
In the United States, the incentive for renewables is similar in general for all producers and can be defined as the energy value (ULSD rack price, for instance) plus various government based incentives previously detailed. These include the Biodiesel Mixture Excise Tax Credit (BTC) and Renewable Fuel Standard Program (RINs value) on the national level, and the Low Carbon Fuel Standard (LCFS in California, Oregon, and British Columbia), plus other states currently considering LCFS programs in review or legislative process.
Several points that should be considered when calculating the renewable incentive. First, the BTC is a short-term program that requires government annual renewal. According to the U.S. Department of Energy:
“This incentive originally expired on December 31, 2017, but was retroactively extended through December 31, 2022, by Public Law 116-94.”48
It should not be taken for granted that this program will continue past 2022. Second, the federal and state credits are shared between the feedstock supplier, renewable fuel producer, and retail sellers.
A simplified sample calculation for the production of renewable diesel compared to the conventional counterparts is included in Table 11 below.
Table 11: Sample Renewables Incentive Calculation
Sample Overall Incentive Calculation Comparison for Renewable Diesel Generation
Conventional Diesel
Renewable Diesel; US General
Renewable Diesel; State Incentive; Chicago (1)
Renewable Diesel; CA LCFS State; Los Angeles (2)
Rack Price (3)
$/Gal
$1.27
$1.27
$1.20
$1.65
BTC (4)
$/Gal
$0.00
$1.00
$1.00
$1.00
RFS (4)
$/Gal
$0.00
$1.20
$1.20
$1.20
State Incentive (4)
$/Gal
$0.00
$0.00
$0.98
$0.00
LCFS (4)
$/Gal
$0.00
$0.00
$0.00
$1.76
Total
$/Gal
$1.27
$3.47
$4.38
$5.61
Notes:
Illinois, Iowa, and Minnesota all have individual state incentives that are independent of LCFS. For illustrative purposes, the value utilized here is for Illinois.
LCFS value shown is for California.
Rack price is the national average for October 2020 for Conventional and General Renewable Diesel. Local prices shown for Chicago and Los Angeles.
Biodiesel Mixture excise Tax Credit, Renewable Fuel Standard Program RIN, State Incentive, and Low Carbon Fuel Standard values are all for October 2020.
As illustrated by the table, the economics of renewable fuels generation are highly specific to the individual producer’s market conditions and state and federal tax incentives. It should be noted that the total incentive listed in the above table is not purely for the refiner, as the state and federal tax credits are shared amongst the producers, feedstock suppliers, and retailers. It is important that renewable diesel projects are approached from a micro level for the refiner to ensure that project economics are sensible. There is no “one size fits all” solution to capital projects for the industry at large.
A method of gauging the cost of a potential renewable plants project is to review comparable costs of other projects and plants that have been built or in planning. Table 12 below lists project costs for two well-known renewable fuels producers in the industry, with information obtained from publicly available sources.
Table 12: Comparable Cost Breakdown Example
A rough order of magnitude cost of a plant can be calculated from knowing the total capital cost and capacity of existing plants and projects. The cost of a desired plant depends on many variables to consider such as greenfield/brownfield scope, capacity, feedstock pretreating, types of products, integration with existing refinery, rails, and offsites. A more precise comparable cost estimate can be made if the breakdown of major costs are known for existing projects. Typical economic capacity scaling formulas can be applied and using cost indices to calculate capital costs to today’s dollars.
The following is an example comparison calculation for a desired 10,000 barrels per day (BPD) renewable diesel plant. The project cost for Diamond Green Diesel Train 1 initial build and Holly Frontier can be used as comparable.
Diamond Green Diesel's initial build of its current Train 1 renewable diesel plant in Norco, LA had a total cost of $370 MM in 2011. They installed a new pretreatment unit, new renewable diesel unit, new rails, and new offsites. A majority of utilities, including hydrogen, used in the renewable diesel unit are obtained and purchased from the nearby refinery. Applying cost indices to 2021, the total cost is $443 MM which equates to ~$2.81/gal/yr (~$43,000/BPD, ~$0.74/liter/yr) for a 10,000 BPD capacity plant.
HollyFrontier is installing a new greenfield renewable diesel unit and pretreatment unit at their Artesia, NM refinery announced in 2019. In addition, HollyFrontier is converting their Cheyenne, WY refinery into renewable diesel production announced in 2020. The pretreatment unit will process 80% of the renewable diesel capacity for both Artesia, NM and Cheyenne, WY. They installed a new pretreatment unit, new renewable diesel unit, new rails, and new offsites at their Artesia, NM location. A majority of utilities, including hydrogen, used in the renewable diesel unit will be brought in from the nearby refinery. Applying cost indices to 2021, the total cost is $629 MM which equates to ~$4.10/gal/yr (~$62,900/BPD, ~$1.08/liter/yr) for a 10,000 BPD capacity plant.
Fossil energy sources, such as coal, oil, and natural gas have supplied the bulk of the energy needs in the United States over the last 100 years. The search for more sustainable fuel alternatives, however, has increased over time due to concerns about the limited availability of these fossil energy sources as well as increased environmental and regulatory legislation resulting in an increased demand for cleaner burning fuels. The path most refineries follow to comply with RFS regulations set forth by the U.S. EPA is by blending renewable fuels into their finished fuel products, or by obtaining credits to meet an EPA specified Renewable Volume Obligation (RVO). Today, renewable fuels are of higher interest for oil refiners because of increasing RIN prices in order to meet their RVO. Others seek the opportunities to expand their business market/portfolio to take advantage of incentives such as RIN credits and LCFS market credits. In the future, it is expected that more states will offer similar incentives to help address the growing concern of carbon emissions from the burning of fossil fuels.
Once a refiner has decided to pursue the production of renewables, they must decide whether to retrofit an existing plant or build a grassroots facility. A grassroots facility has the advantage of incorporating new technologies and leaves open the greatest opportunity for optimization for the selected feedstock and desired product. On the downside, grassroots requires a larger, up-front capital investment. Retrofit of an existing plant is also a faster route to get into the renewables production market. It allows a refiner to leverage current assets, but requires thoughtful planning for how to best optimize these assets for renewable feedstocks. The switch to renewables is associated with reduced throughput as compared to crude oil feed. Another option for retrofit is to co-process renewable feedstocks alongside petroleum based crude oil.29 Even a small amount of renewably sourced product can benefit from the incentives for low carbon steps in the fuel producing process. A simple summary plan for existing refiners to evaluate current assets and options is outlined below.
Inventory of existing equipment to maximize existing asset value
Impacts on gasoline blending
Impacts on G/D ratio, light ends production, petrochemical feedstocks, aromatics, lubes, and asphalt
Refinery impacts on fuel gas balance
Other projects to support future configuration
Safety aspects as compared to conventional refinery
Environmental considerations such as fired heater duty and NOx implications compared to conventional plant
Building a grassroots renewable fuels plant will have to consider location, feedstock sourcing, products, and product market. All of these major categories are discussed in detail in this article and should be applied and investigated in a business model.
The biggest advantage to a grassroots facility is the chance to optimize the unit to renewable fuels production. The capital investment is high, but the long term plant reliability and operability would reflect the fit for purpose design. Additionally, there is more flexibility regarding what can be built and where. For example, deciding the plant location should consider accessible and available feed source and the ability to deliver to the product market. The producer also will want to consider being able to capitalize on LCFS credits by participating in the California and Oregon LCFS program, and other states ready to adopt an LCFS program.
Although the renewable fuels sector is growing, there are only a few refineries that have integrated the production of renewable fuels into their plants. One of the key advantages for existing refineries is leveraging the existing infrastructure and equipment to reduce overall cost and construction time in comparison to building a grassroots renewable fuels unit. There are several factors outside of the main processing/reactor technology that need to be considered to determine the viability of a conversion of an oil refinery to produce renewable fuels.
There are two paths to start the processing of renewable feedstocks into renewable fuels in an existing oil refinery. It can either be done as a stand-alone option meaning 100% renewable feedstocks or co-processing of both fossil-based and renewable feedstocks.
The decision is ultimately be driven by the refinery’s objectives and more importantly the economics. While making this decision, a refiner may consider:
Do I want to expand my business line?
Where can I source a sustainable feed?
Do I want to produce a specific renewable fuel?
How can I meet finished product specifications?
Do I want to claim or purchase RIN credits?
How can I increase margins?
How can I extend the useful life of my facility?
How can I best utilize my existing hardware with new renewables feedstocks?
Ascent’s core strengths include the modification/revamp of existing processes to identify innovative solutions that meet required process objectives for the least amount of capital investment. Ascent has a deep understanding of the workings and interconnectivity of process units across the petroleum, chemical, and alternative energy industry. Ascent’s experience and technical expertise in these areas can help a refiner identify the optimal configuration for their plant.
As discussed in previous sections, there are a variety of glyceride feedstocks used to produce renewable fuels which include animal fats such as beef tallow and pork lard, plant derived oils such as soybean, sunflower, rapeseed, and palm, as well as waste cooking oils/greases.
However, several of these traditional feedstocks already have established markets in the food, chemicals, and biofuels industry, which can result in a premium price point to meet the higher demand. This has also led to more research to find new (non-edible) feed sources such as jatropha, camelina, and pennycress.49 Additionally, as the industry moves away from edible feedstocks, waste oils and other dirty feeds require additional pretreatment, which also factors into overall cost and feedstock selection.
One way to overcome this initial challenge is to form a partnership with the feedstock supplier. Another way is to evaluate the processing of a blend of feed oils, similar to what is done with crude oil. This can provide the advantage of more control over feedstock purity, for example with a blend of high and low contaminant feeds, thereby reducing pretreatment investment.50 Another purity/quality feed pretreatment consideration is whether the plant will require upgrades to the metallurgy of the existing systems (feed storage and preheat systems) as well as establishing hydrogen requirements.
In addition to feedstock availability, a refiner should consider the plant’s proximity to the feedstock market. The typical method of transporting of renewables feeds is via rail. Some refineries may have the existing railway infrastructure to support this, but this is not to deter the refineries that do not. Options can include expansion of an existing railway system to a remote location and include the necessary loading/unloading/blending facilities and pump systems to send to the refinery via pipeline.
Renewable feedstocks come in a variety of forms, from waste oils to fats that are solids at room temperature to solid biomass. The goal for all of it is to transform it into a feed liquid that can be transformed into renewable diesel. For example, seed conversion to oils require a mill that crushes the seeds and presses out 90-95% of the oil. Once in liquid form, all renewable feedstocks require filtration to remove remaining solids. Oil shipped for processing requires further pretreatment.
Glycerides, by nature, are acidic and can contain a certain concentration of free fatty acids. One challenge with renewable feeds is that glycerides can break down into more free fatty acids under heated conditions. Considering the amount of water byproduct that results from renewables hydroprocessing, there is a very real concern for corrosion issues in the piping and equipment in the reactor circuit. Metallurgy should be checked and may limit either the type of feedstocks that can be processed or the pretreatment types required, or metallurgical upgrades may be required.
Glyceride feedstocks also contain impurities such as:
Moisture
Phospholipids
Metalolipids
Alkali Metals
Sulfur
These impurities can impact catalyst life, metallurgy of piping and equipment, and product yields. Besides filtration, water/acid degumming and bleaching are a few types of pretreatment processes that may be required. The type and level of pretreatment required will depend on the feed source(s) and concentrations of impurities. Particularly bad feedstocks may require pretreatment twice.50 Including multiple pretreatment types on-site allows flexibility in feedstock sources. A pretreatment facility is not a process found in a typical oil refinery and so it would require a stand-alone system. It is also an option for feedstock pretreatment to occur offsite at a separate facility.
Sulfur in particular has additional options for treatment. This compound is not foreign to refiners and most have units on the back end of their plant for sulfur removal.50
Finally, the treated feed oil may be removed of solids, but many vegetable oils and animal fats are waxy or even solid at ambient temperatures. Heat tracing, either steam or electric, is required to keep piping and vessels warm enough to maintain the oils in liquid form.
The main approach for processing these feedstocks into renewable diesel is through hydroprocessing, specifically via catalytic deoxygenation and decarboxylation reactions.27 This is a similar process technology used in a typical oil refinery, with the difference being that hydrodesulfurization, denitrogenation, and hydrocracking are the primary reactions of interest. The reactor itself will normally consist of a multi packed bed and quench system; as a result, understanding the existing refinery configuration will play an important part in determining the extent of infrastructure/equipment that can be reused, as illustrated below in Figure 11.
Figure 11: Refinery Conversion Options based on Existing Configuration
The reactions required to process glycerides into renewable fuels fall under the same chemistry as processing of a petroleum feed in a hydrotreater, which targets the removal of specific heteroatoms (i.e., sulfur, nitrogen, and oxygen) and saturation of olefinic and aromatic bonds with the addition of hydrogen. Assuming a seed oil-based triglyceride, the primary reaction pathways found in the production of renewable diesel begin with the saturation of double bonds in the triglyceride’s fatty acid chains followed by removal of the oxygen atoms found on the triglyceride’s ester, leaving behind a saturated hydrocarbon chain. A simplified sketch of the primary reactions is shown in Figure 12 below. The hydrodeoxygenation reaction (HDO) removes the oxygen to produce H2O alongside propane and paraffins of the same chain length as the initial fatty acid chain. This pathway consumes more hydrogen than the other reactions but has a slightly higher yield. The decarbonylation (DCO) and decarboxylation (DCO2) reactions remove the oxygen to produce CO and CO2, respectively, alongside propane and paraffins with one fewer carbon atom than the initial fatty acid chain. These pathways consume a bit less hydrogen, but also have slightly lower yields because of the fewer carbons that are available to the paraffin chain, as they are consumed to generate the CO/CO2 byproducts.51 The decarbonylation and decarboxylation pathways could consume excess hydrogen if the CO/CO2 that is produced is converted to methane via the undesirable reverse water gas shift and methanation side reactions. The reaction pathways can be controlled by catalyst selection and operating conditions.
Figure 12: Triglyceride Hydrodeoxygenation, Decarbonylation, and Decarboxylation Reactions
One key difference between hydroprocessing crude oil versus hydroprocessing renewable feedstocks is that the HDO and DCO/DCO2 reactions are much more exothermic for renewable feedstocks, requiring multiple beds and/or multiple reactors.52 Evaluation of the existing quench system is critical to avoid runaway, to ensure proper heat balance across the reactor to maintain high yield, and to mitigate loss of product due to undesired side reactions, cracking, and coke formation. This applies even when co-processing a small percentage of renewable feedstocks.53
The higher hydrogen consumption and associated heat of reaction associated with renewables requires more intensive quenching requirements. Ascent has reviewed and designed multiple systems for increased heat removal including:
Speeding up of recycle gas compressor
Addition of a liquid product recycle to obtain a higher heat sink
Combination of recycle gas and liquid product recycle
Lowering of cold low pressure separator temperature
There are advantages and disadvantages to each of these approaches. Increasing the quench gas rate can lead to higher product quality, but can also lead to higher bed pressure drops (due to higher velocity). While use of a liquid quench provides a higher heat capacity fluid, it can lead to increased LHSV. LHSV, or Liquid Hourly Space Velocity, is the ratio of liquid volume of feed per hour to catalyst volume and is a measure of residence time of the feed in the reactor, which has a direct effect on reaction kinetics. The higher quench requirements can also result in a limit on feed throughput and will require a hydraulic evaluation of the reactor loop. Sequencing of multiple reactors in series is an option that can also be considered to increase the throughput of renewable feeds.
The reactor effluent will have a much higher mass enthalpy due to the higher quench rates which will require evaluation of the existing heat integration. Ascent can provide the experience required to review such systems to ensure maximum heat recovery and minimization of utility consumption.
As discussed above, the primary HDO/DCO/DCO2 conversion reactions consume a significant amount of hydrogen in comparison to a conventional hydrotreater. In addition to these reactions, the percentage of free fatty acids in the feedstock contributes to a higher olefinic concentration, which also requires more hydrogen for bond saturation. The hydrogen consumed in a conventional hydrotreater/hydrocracker can range anywhere between 100 to 600 scf H2/bbl of feed. When processing 100% renewable feed, the hydrogen consumed can be as high as 1,700 to 2,220 scf H2/bbl of feed.51 This additional hydrogen requirement takes up capacity in the existing equipment; thus the switch from conventional feeds to renewable feeds cannot be traded as a barrel for barrel. A decrease in unit throughput is to be expected based on the issues already discussed, but can be maximized based on proper evaluation of the hydrogen system and heat balance. One advantage of a renewable feedstock is the typically lower sulfur and nitrogen content in comparison to a fossil feedstock, which requires a lower hydrodesulfurization conversion in order to meet ULSD standards.54
The amount of additional hydrogen required will be dependent on the amount and type of renewable feedstock processed as well as reaction conditions favoring either hydrodeoxygenation or decarbonylation/decarboxylation pathways. Options for obtaining the additional hydrogen include installation of an additional hydrogen plant, replacement of the existing hydrogen plant with larger equipment, importing hydrogen, or retrofits to debottleneck the existing hydrogen plant. For example, opportunities to retrofit an existing steam methane reformer (SMR) hydrogen plant for additional hydrogen needs of up to 30% include reactor modifications, reformer upgrade, or installation of pre- or post-reformer. When considering which option to pursue, the refiner should consider how much additional hydrogen is required.55 Opportunities for renewable hydrogen should also be considered as discussed below.
Although the glyceride-based feedstock is renewable, the hydrogen supplied to the reactor is typically generated via steam reformation using methane (i.e., natural gas). This process, called SMR or Steam Methane Reforming, along with the associated water gas shift reaction, contribute to the production of CO2 as byproduct to this so-called “grey” hydrogen. The impact of this CO2 production on renewable diesel’s CI score is not insignificant and any steps that can be taken to reduce the CI score of the hydrogen will directly benefit the CI score of the final product.
One way to reduce the CI score for hydrogen production is to find a sustainable source for SMR feed. This can range from re-use of the offgas that results from hydroprocessing the renewable diesel to capturing methane from livestock farms as feed. Recall that one of the side reactions to the primary hydrodeoxygenation, decarbonylation, and decarboxylation reactions is methanation. While the production of methane is not preferred, there is a potential home for the methane in the SMR to produce hydrogen. Use of the methane in this manner would result in a lower CI score of the finished fuel product.
Use of blue (petroleum based with carbon capture and sequestration, CCS) or green (entirely non-petroleum based) hydrogen is another consideration for reducing the overall carbon footprint. Blue hydrogen, like the grey hydrogen described above, is also typically produced by a SMR, but in this case, the product CO2 is captured, transported to a storage site (typically via pipeline), and deposited deep under the surface of the earth in porous rock formations. The rock above the storage site is impermeable and does not allow the CO2 to escape. Because CCS does not capture 100% of the CO2, production of blue hydrogen is considered a low carbon emitting process as opposed to truly carbon neutral. As of 2021, there is no official standard for defining how much CO2 must be captured in order to qualify as blue as opposed to grey hydrogen. However, CertifHy is a consortium of companies aiming to develop the first such standard for the EU to define green and blue hydrogen. In 2019, CertifHy proposed a threshold greenhouse gas footprint of 36.4 gCO2eq/MJ for blue hydrogen, which is 60% lower than the benchmark 91 gCO2eq/MJ greenhouse gas footprint.56,57
Green hydrogen is produced without CO2 as a byproduct and is a truly carbon neutral process. This is achieved by electrolysis of water, splitting it into hydrogen and oxygen, where the hydrogen is captured and the oxygen may be vented to atmosphere with no negative impact on emissions. Electrolysis requires an electrical current, which must be sustainably sourced for the hydrogen to be considered “green”. Such green power sources may include using solar, wind, or hydro energy, but these technologies themselves have limitations based on location and weather conditions that vary throughout the year. One option for location of a green hydrogen plant is to integrate it with a dedicated solar, wind, or hydropower plant, though this would require additional infrastructure to collect and transport the hydrogen to the renewable refinery.
There are many factors for a refiner to consider in the decision to source either blue or green hydrogen. The cost to produce green hydrogen is high, estimated at 2-3 times the cost of blue hydrogen, according to the International Renewable Energy Agency (IRENA).58 That being said, green hydrogen would offer the biggest reduction in CI score. The biggest advantage to blue hydrogen over green hydrogen is that it can take advantage of existing refinery infrastructure, i.e. the SMR, and only the CCS infrastructure is required new. Because blue hydrogen may be faster for a refiner to implement and at a lower cost than a green hydrogen plant, blue hydrogen can serve as an interim means to a lower CI score while the world waits for green hydrogen technology to evolve. Regardless of green or blue, both options represent a means to achieving a lower CI score than grey hydrogen (see Table 5), which warrants consideration if the economics demonstrate viability.
Whether a refiner currently imports hydrogen or produces hydrogen on site, Ascent can help determine the options best suited for the plant to start producing renewable fuels.
The reaction mechanisms of hydrodeoxygenation, decarbonylation, and decarboxylation produce much larger amounts of CH4, CO, CO2, and H2O in comparison with conventional hydrotreating.
Excess CH4 and CO can lead to a lower recycle gas purity which can affect the hydrogen partial pressure in the reactor. Increasing the purge gas rate may be one solution, but understanding the impacts of the excess CO on the downstream units is just as important as the impacts to the hydrotreating unit. The production of these by-products and subsequent additional purging may require additional make-up hydrogen to maintain purity.
The higher amounts of CO2 may form carbonic acid in the reactor effluent cooling system where free water is typically present via a combination of water injection points and condensation. Review of this system should include the sour water system to ensure adequate handling of the additional water generated by these reactions as well as the additional dissolved CO2 that it may have.
In addition, if the gas byproducts that are sourced from renewable feedstocks are re-used in a process (e.g. fuel gas, producing electricity, producing hydrogen, etc.), it can be considered a new-negative carbon emission. This can be further compounded by capturing methane from cattle livestock farms if possible. This will assist in lowering the overall CI score of the produced transportation fuel.
An existing refinery will already have infrastructure in place for emergency depressurization and flare. Due to the highly exothermic nature of the hydrodeoxygenation, decarbonylation, and decarboxylation reactions, safeguarding procedures and equipment must be reviewed in order to ensure proper mitigation in the case of runaway reaction or quench system failure. The system should be checked for proper metallurgy due to different types of relief material as well as capacity.
Operation of a Renewable Fuels plant is a continuous process that operates 24 hours a day. The feed and product flow from the plant are continuous and operate at a steady state within the many unit operations that make up the plant sequencing. Plant staffing typically includes personal organized into shifts or crews that work a rotating sequence of shifts to cover nights, weekends and holidays. Plant routine maintenance is typically provided on a weekday only basis except for emergency repairs. Outside utilities for the plant include treated water to make process steam, power, instrument air, and nitrogen for inerting of equipment. A safety management plan and appropriate engineering and building standards are required to operate a safe, reliable facility.
Feedstock arrives in batches to the facility via rail, barge or truck. No pipeline transport is practiced at this time. A fixed roof storage tank that is heated with internal steam coils holds the feed material and provides surge capacity for the facility. The feed is in liquid form and can be continuously pumped into the process. Operations regularly samples the feed material both as it arrives and as it is fed to the plant. Quality control tests are conducted on the feedstock on a regular basis to give early indication to the operators of any changes to plant operations that are needed to adjust to feed quality variability.
Feed filtration is the initial step of processing. Many facilities will invest in on-line cleanable filtration hardware that is installed with backup capacity so that filter cleaning does not slow or stop downstream processing. An offsite storage and settling operation is often used in order to concentrate the contaminates captured in the filtration system for disposal. A well-designed system cleans the feed and returns a very high percentage back to the feed tank so that it can then be processed into finished products.
The heart of the process is the high pressure, hydrogen rich catalytic environment where the chemical change occurs to transform oil, fat, molecules into valuable finished renewable products. The inputs to this system require a continuous supply of hydrogen that is mostly consumed along with the transformation of the feed molecules into products. Hydrogen supply can be from a plant owned facility or can be contracted via a gas supply company and piped across the plant fence usually from a nearby facility with a high onstream reliability. The renewable fuels plant will need to be shutdown imminently if hydrogen supply is interrupted.
The reactions occur inside thick-walled pressure vessels of allow steel, and require precise temperature, pressure, and composition monitoring and testing. The manufacturing process is a sequence of steps that rely upon each other to obtain product that meets final specifications. Normal process control includes sophisticated digital control system that is designed and maintained to support plant operations.
Catalyst operations run in over a multi-year cycle where the activity and performance of the catalyst gradually degrades. Good feedstock quality monitoring is essential to obtain the optimal catalyst use. Catalyst materials are highly specialized and are procured from chemical vendors that also support the petroleum refining industry. The loading and initial activation of the catalysts in the renewable fuels reactors is a separate batch process that requires expert monitoring and supervision often provided by a representative of the catalyst supply company.
Contingency operations for the high pressure, highly flammable process operations are essential. These typically include provision of a safety release system that is used in emergencies to de-pressure the reaction environments to safe location and flared to prevent impact beyond the plant boundary.
The material produced in the catalytic section is separated from the recycle hydrogen and removed of byproducts made in the reaction. Considerable operations are required to perform these separations, with the goal of minimizing low value or hazardous waste products. Some of the reaction’s byproducts are poisonous and require very secure handling and special downstream process steps to protect plant workers and the environment.
The yield of the renewable diesel is monitored by plant staff to maximize the value of the process. Adjustments can be made to the catalytic operation conditions to keep plant yields inside a target specification.
Auxiliary processing of the byproducts may require add-on facilities in the areas of water processing, gas processing, and carbon oxides conversion.
Some byproducts may be suitable for recycle via the hydrogen generation facility and thereby reduce the amount of purchased hydrogen plant feedstock.
The transportation fuel industry is at a crossroads in which petroleum refiners have a business choice to make; to stay on a petroleum-based operation path, to pursue an emerging renewable fuels operation path, or possibly both. The petroleum industry has done wonders in helping shape and grow the U.S. economy since the industrial age but government mandates and changing public sentiment on carbon emissions are driving a shift towards renewably sourced energy. In the long term, sustainability appears to be on a path towards electrification with renewable liquid fuels replacing conventional transportation fuels, including gasoline, diesel, and jet. The 2020 COVID-19 pandemic has caused a short-term drop in demand for transportation fuel and likely hastened the peak oil time frame. Petroleum refiners would do well in a changing landscape by considering renewable fuels in their business plans.
Existing petroleum refiners and emerging renewable fuel startup technologies alike have an opportunity to capitalize in the path to zero emission energy consumerism. The outlook of the petroleum-based transportation fuel market is facing headwinds driven by demand for GHG reductions and sustainable energy future. Current government programs are affecting business decisions to shift into renewables due to renewable volume and carbon obligations levied on the transportation fuel industry. In the consumer automobile market, the cost of electric cars is projected to reach price parity with internal combustion engines (ICE), which would drive increasing consumer demand on the alternative technology and reduce liquid fuel demand.
Liquid transportation fuel is still expected to be relevant and in demand in the long path to carbon neutrality. In the transportation sector, the full realization of zero emission energy consumerism sees two major hurdles: consumer adoption of electric vehicles and a zero emission U.S. electricity grid. The public sentiment for electric vehicles is stronger today than it was ten years ago. An increasing consumer adoption of electric vehicles is expected within the decade, with expectations of significantly taking market share from ICE vehicles. Increased adoption of electric vehicles in the near future will eliminate tail pipe emissions, but it will not eliminate electric generation emissions until the majority of the U.S. electric grid is powered by non-carbon emitting processes. Even if both the consumer automobile market and electric grid were zero emission, there currently exists approximately 280 million ICE vehicles in the United States that would need to be replaced before their emissions could be eliminated.
Petroleum refiners are in an ideal position to use existing assets and infrastructure to economically renew themselves for the renewable age. The large installed assets such as hydrotreater units, reformers, rails, ports, and control rooms can be effectively revamped into renewable processing facilities at a cheaper cost than grassroots. There are numerous refiners today that are transitioning their existing plants into renewable fuels, both full refinery conversion and co-processing petroleum/renewables conversion. Ascent can help refiners evaluate their options, from selecting and working with a licensor to assessing existing assets, feedstock, and product options.
Emerging renewable fuels and energy startup technologies also have an opportunity to commercialize in the renewable age. As new technologies are proven successful on the laboratory scale, one of the most common hurdles to mass production is scale-up of the technology into pilot plant and commercialization. Ascent can help startup companies develop the industrial equipment required to grow from lab to mass production flow rates, evaluate and optimize the processing options, and design full scale production facilities.
Renewable diesel: hydrotreated product of vegetable or fatty acid oils
Biodiesel: product of transesterification of vegetable or fatty acid oils, also known as Fatty Acid Methyl Ester or FAME
Glycerol: byproduct of transesterification of vegetable or fatty acid oils
Green diesel: colloquialism
Fatty acids: aliphatic monocarboxylic acids in an animal or vegetable fat, oil, or wax. Natural fatty acids are linear chains of 4 to 28 carbons and contain a range of 0 to 2 unsaturated bonds.
Glycerides: naturally occurring glycerol esters from fatty acids. Glycerides are subdivided into triglycerides by the number and positions of the acyl groups:
1,2- or 1,3-diglycerides
1- or 2- monoglycerides
Glycerides distribution of carbons and double bounds is defined as XX:Y
XX is the number of carbons in the fatty acid chain
Y is the number of double bonds
For example, XX:Y for oleic acid is 18:01 (18 carbons, 1 double bond, and 2 oxygens)
The distribution is used to calculate the MW and physical properties
Hydrodeoxygenation Reaction (HDO): Reaction step in the hydroprocessing of renewable diesel in which oxygen is removed from a glyceride to produce H2O
Decarbonylation Reaction (DCO): Reaction step in the hydroprocessing of renewable diesel in which oxygen is removed from a glyceride to produce CO
Decarboxylation Reaction (DCO2): Reaction step in the hydroprocessing of renewable diesel in which oxygen is removed from a glyceride to produce CO2
E10 Gasoline: Petroleum gasoline blended with up to 10% ethanol
E15 Gasoline: Petroleum gasoline blended with up to 15% ethanol
E85 Gasoline: Petroleum gasoline blended with up to 85% ethanol
B5 Biodiesel: Petroleum diesel blended with up to 5% FAME
B20 Biodiesel: Petroleum diesel blended with up to 20% FAME
United Nations Environment Programme & Organisation for Economic Co-operation and Development. (1999). “Phasing Lead out of Gasoline: An Examination of Policy Approaches in Different Countries.” https://www.oecd.org/chemicalsafety/risk-management/1937036.pdf
Liu, H., Ma, J., Tong, L., Ma, G., Zheng, Z., Yao, M. (2018). “Investigation on the Potential of High Efficiency for Internal Combustion Engines.” Energies, 11(3), 513. https://doi.org/10.3390/en11030513
Khadka, C. (2017). “How Much Money Can an Equation Really Save? Standard Test Method for Calculating Cetane Index via Four Variable Equation.” Economic Journal of Development Issues, 19(1-2), 60-76. https://doi.org/10.3126/ejdi.v19i1-2.17702
Sahasrabudhe, S., Rodriguez-Martinez, V., O'Meara, M., Farkas, B. (2017). “Density, viscosity, and surface tension of five vegetable oils at elevated temperatures: Measurement and modeling.” International Journal of Food Properties, 20(sup2), 1965-1981. https://doi.org/10.1080/10942912.2017.1360905
Qari H., Rehan M., Nizami A. (2017). “Key Issues in Microalgae Biofuels: A Short Review”, 9th International Conference on Applied Energy, ICAE2017, 21-24, Cardiff, UK. Published by Elsevier Ltd. Peer-reviewed under responsibility of the scientific committee of the 9th International Conference on Applied Energy. https://doi.org/10.1016/j.egypro.2017.12.144
Ferdouse, F., Lovstad Holdt, S., Smith, R., Murúa, P., Yang, Z. (2018). “The global status of seaweed production, trade and utilization.” FAO Globefish Research Programme, 124. Food and Agriculture Organization of the United Nations. https://orbit.dtu.dk/files/163078059/FAO_report_Global_seaweed_2018.pdf
Milledge, J., Smith, B., Dyer, P., Harvey, P. (2014). “Macroalgae-Derived Biofuel: A Review of Methods of Energy Extraction from Seaweed Biomass”, Energies, 7(11), 7194-7222. https://doi.org/10.3390/en7117194
Gerpen, J., Shanks, B., Pruszko, R., Clements, D., Knothe, G. (2004). “Biodiesel Production Technology, August 2002 – January 2004.” Subcontractor’s Report, NREL/SR-510-36244. https://www.nrel.gov/docs/fy04osti/36244.pdf
Rocha, J., Santos, M., Madeira, F., Rocha, S., Bauerfeldt, G., Silva, W., Salomao, A., Tubino, M. (2019). “Influence of Fatty Acid Methyl Ester Composition, Acid Value, and Water Content on Metallic Copper Corrosion Caused by Biodiesel.” Journal of the Brazilian Chemical Society, 30(8), 1751- 1761. https://doi.org/10.21577/0103-5053.20190078
Kinast, J. (2003). “Production of Biodiesels from Multiple Feedstocks and Properties of Biodiesels and Biodiesel/Diesel Blends.” Subcontractor’s Report, NREL/SR-510-31460. https://www.nrel.gov/docs/fy03osti/31460.pdf
Egeberg, R., Michaelsen, N., Skyum, L., Zeuthen, P. “Hydrotreating in the production of green diesel.” PTQ, Q2, 2010. www.digitalrefining.com/article/1000156
Anand, M., Sinha, A. (2012). “Temperature-dependent reaction pathways for anomalous hydrocracking of triglycerides in the presence of sulfided Co-Mo- catalyst.” Bioresource Technology, 126, 148-155. https://doi.org/10.1016/j.biortech.2012.08.105
Egeberg R., Knudsen K., “Industrial-scale production of renewable diesel”, PTQ Q3, 2011. digitalrefining.com/article/1000389/industrial-scale-production-of- renewable-diesel
Zeuthen P., Rasmussen H., “Assessing the challenges associated with renewable diesel hydrotreating”, Haldor Topsoe May 2016.
Panuccio, G., Rabold, T., Meagher, J., Drnevich, R., Janarthanan, V. “Debottlenecking hydrogen plant production capacity.” Revamps, 2010. www.digitalrefining.com/article/1000471
Noussan, M., Raimondi, P., Scita, R., Hafner, M. (2021). “The Role of Green and Blue Hydrogen in the Energy Transition: A Technological and Geopolitical Perspective.” Sustainability, 13(1), 298. https://doi.org/10.3390/su13010298